

210
8 Other Topics
3000
3200
3400
3600
3800
4000
Frequency [cm ]
-1
0
-0.5
0.5
1.0
1.5
(arb. unit)
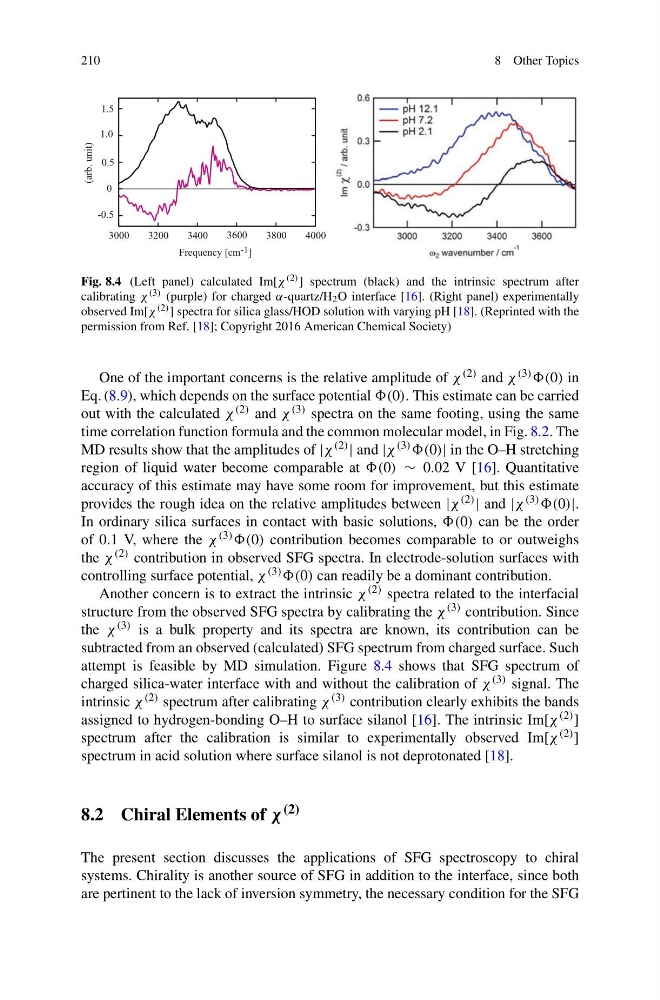
Fig. 8.4 (Left panel) calculated Im[χ (2) ] spectrum (black) and the intrinsic spectrum after
calibrating χ (3) (purple) for charged α-quartz/H 2 O interface [16]. (Right panel) experimentally
observed Im[χ (2) ] spectra for silica glass/HOD solution with varying pH [18]. (Reprinted with the
permission from Ref. [18]; Copyright 2016 American Chemical Society)
One of the important concerns is the relative amplitude of χ (2) and χ (3) (0) in
Eq. (8.9), which depends on the surface potential (0). This estimate can be carried
out with the calculated χ (2) and χ (3) spectra on the same footing, using the same
time correlation function formula and the common molecular model, in Fig. 8.2. The
MD results show that the amplitudes of |χ (2) | and |χ (3) (0)| in the O–H stretching
region of liquid water become comparable at (0) ∼ 0.02 V [16]. Quantitative
accuracy of this estimate may have some room for improvement, but this estimate
provides the rough idea on the relative amplitudes between |χ (2) | and |χ (3) (0)|.
In ordinary silica surfaces in contact with basic solutions, (0) can be the order
of 0.1 V, where the χ (3) (0) contribution becomes comparable to or outweighs
the χ (2) contribution in observed SFG spectra. In electrode-solution surfaces with
controlling surface potential, χ (3) (0) can readily be a dominant contribution.
Another concern is to extract the intrinsic χ (2) spectra related to the interfacial
structure from the observed SFG spectra by calibrating the χ (3) contribution. Since
the χ (3) is a bulk property and its spectra are known, its contribution can be
subtracted from an observed (calculated) SFG spectrum from charged surface. Such
attempt is feasible by MD simulation. Figure 8.4 shows that SFG spectrum of
charged silica-water interface with and without the calibration of χ (3) signal. The
intrinsic χ (2) spectrum after calibrating χ (3) contribution clearly exhibits the bands
assigned to hydrogen-bonding O–H to surface silanol [16]. The intrinsic Im[χ (2) ]
spectrum after the calibration is similar to experimentally observed Im[χ (2) ]
spectrum in acid solution where surface silanol is not deprotonated [18].
8.2 Chiral Elements of χ (2)
The present section discusses the applications of SFG spectroscopy to chiral
systems. Chirality is another source of SFG in addition to the interface, since both
are pertinent to the lack of inversion symmetry, the necessary condition for the SFG
8 Other Topics
3000
3200
3400
3600
3800
4000
Frequency [cm ]
-1
0
-0.5
0.5
1.0
1.5
(arb. unit)
Fig. 8.4 (Left panel) calculated Im[χ (2) ] spectrum (black) and the intrinsic spectrum after
calibrating χ (3) (purple) for charged α-quartz/H 2 O interface [16]. (Right panel) experimentally
observed Im[χ (2) ] spectra for silica glass/HOD solution with varying pH [18]. (Reprinted with the
permission from Ref. [18]; Copyright 2016 American Chemical Society)
One of the important concerns is the relative amplitude of χ (2) and χ (3) (0) in
Eq. (8.9), which depends on the surface potential (0). This estimate can be carried
out with the calculated χ (2) and χ (3) spectra on the same footing, using the same
time correlation function formula and the common molecular model, in Fig. 8.2. The
MD results show that the amplitudes of |χ (2) | and |χ (3) (0)| in the O–H stretching
region of liquid water become comparable at (0) ∼ 0.02 V [16]. Quantitative
accuracy of this estimate may have some room for improvement, but this estimate
provides the rough idea on the relative amplitudes between |χ (2) | and |χ (3) (0)|.
In ordinary silica surfaces in contact with basic solutions, (0) can be the order
of 0.1 V, where the χ (3) (0) contribution becomes comparable to or outweighs
the χ (2) contribution in observed SFG spectra. In electrode-solution surfaces with
controlling surface potential, χ (3) (0) can readily be a dominant contribution.
Another concern is to extract the intrinsic χ (2) spectra related to the interfacial
structure from the observed SFG spectra by calibrating the χ (3) contribution. Since
the χ (3) is a bulk property and its spectra are known, its contribution can be
subtracted from an observed (calculated) SFG spectrum from charged surface. Such
attempt is feasible by MD simulation. Figure 8.4 shows that SFG spectrum of
charged silica-water interface with and without the calibration of χ (3) signal. The
intrinsic χ (2) spectrum after calibrating χ (3) contribution clearly exhibits the bands
assigned to hydrogen-bonding O–H to surface silanol [16]. The intrinsic Im[χ (2) ]
spectrum after the calibration is similar to experimentally observed Im[χ (2) ]
spectrum in acid solution where surface silanol is not deprotonated [18].
8.2 Chiral Elements of χ (2)
The present section discusses the applications of SFG spectroscopy to chiral
systems. Chirality is another source of SFG in addition to the interface, since both
are pertinent to the lack of inversion symmetry, the necessary condition for the SFG