

71
on the other hand, the comparison of calculated and observed spectra of 2-carene
gives us information, not only about absolute configuration and conformation but
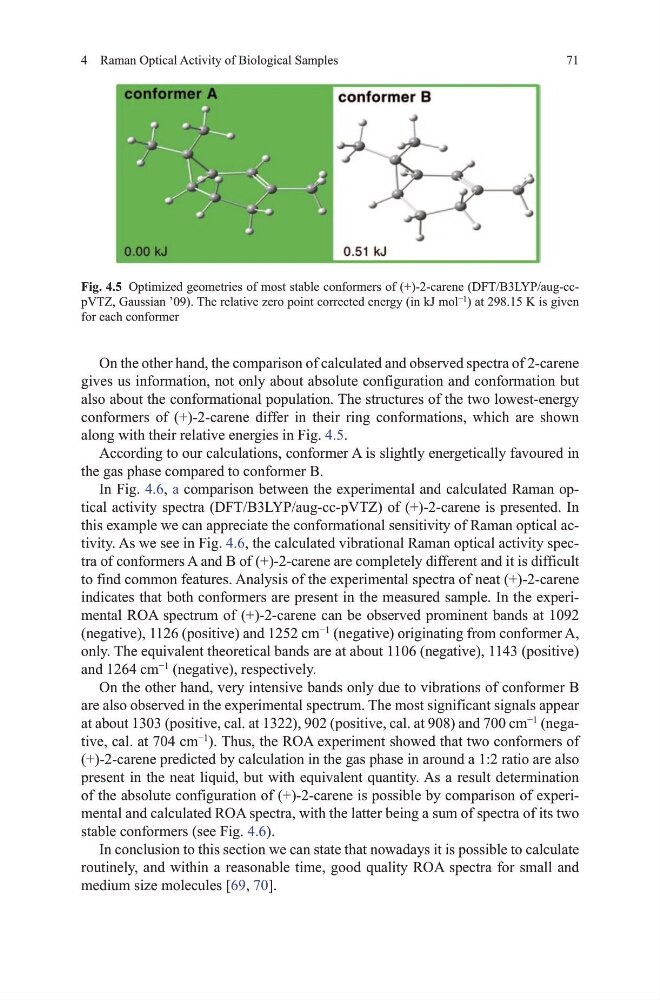
also about the conformational population. the structures of the two lowest-energy
conformers of (+)-2-carene differ in their ring conformations, which are shown
along with their relative energies in Fig. 4.5.
According to our calculations, conformer A is slightly energetically favoured in
the gas phase compared to conformer B.
In Fig. 4.6, a comparison between the experimental and calculated Raman optical activity spectra (dFt/B3LYP/aug-cc-pvtZ) of (+)-2-carene is presented. In
this example we can appreciate the conformational sensitivity of Raman optical activity. As we see in Fig. 4.6, the calculated vibrational Raman optical activity spectra of conformers A and B of (+)-2-carene are completely different and it is difficult
to find common features. Analysis of the experimental spectra of neat (+)-2-carene
indicates that both conformers are present in the measured sample. In the experimental RoA spectrum of (+)-2-carene can be observed prominent bands at 1092
(negative), 1126 (positive) and 1252 cm
−1
(negative) originating from conformer A,
only. the equivalent theoretical bands are at about 1106 (negative), 1143 (positive)
and 1264 cm
−1
(negative), respectively.
on the other hand, very intensive bands only due to vibrations of conformer B
are also observed in the experimental spectrum. the most significant signals appear
at about 1303 (positive, cal. at 1322), 902 (positive, cal. at 908) and 700 cm
−1
(negative, cal. at 704 cm
−1
). thus, the RoA experiment showed that two conformers of
(+)-2-carene predicted by calculation in the gas phase in around a 1:2 ratio are also
present in the neat liquid, but with equivalent quantity. As a result determination
of the absolute configuration of (+)-2-carene is possible by comparison of experimental and calculated RoA spectra, with the latter being a sum of spectra of its two
stable conformers (see Fig. 4.6).
In conclusion to this section we can state that nowadays it is possible to calculate
routinely, and within a reasonable time, good quality RoA spectra for small and
medium size molecules [69, 70].
Fig. 4.5 optimized geometries of most stable conformers of (+)-2-carene (dFt/B3LYP/aug-ccpvtZ, gaussian ’09). the relative zero point corrected energy (in kJ mol
−1
) at 298.15 K is given
for each conformer
4 Raman optical Activity of Biological Samples
on the other hand, the comparison of calculated and observed spectra of 2-carene
gives us information, not only about absolute configuration and conformation but
also about the conformational population. the structures of the two lowest-energy
conformers of (+)-2-carene differ in their ring conformations, which are shown
along with their relative energies in Fig. 4.5.
According to our calculations, conformer A is slightly energetically favoured in
the gas phase compared to conformer B.
In Fig. 4.6, a comparison between the experimental and calculated Raman optical activity spectra (dFt/B3LYP/aug-cc-pvtZ) of (+)-2-carene is presented. In
this example we can appreciate the conformational sensitivity of Raman optical activity. As we see in Fig. 4.6, the calculated vibrational Raman optical activity spectra of conformers A and B of (+)-2-carene are completely different and it is difficult
to find common features. Analysis of the experimental spectra of neat (+)-2-carene
indicates that both conformers are present in the measured sample. In the experimental RoA spectrum of (+)-2-carene can be observed prominent bands at 1092
(negative), 1126 (positive) and 1252 cm
−1
(negative) originating from conformer A,
only. the equivalent theoretical bands are at about 1106 (negative), 1143 (positive)
and 1264 cm
−1
(negative), respectively.
on the other hand, very intensive bands only due to vibrations of conformer B
are also observed in the experimental spectrum. the most significant signals appear
at about 1303 (positive, cal. at 1322), 902 (positive, cal. at 908) and 700 cm
−1
(negative, cal. at 704 cm
−1
). thus, the RoA experiment showed that two conformers of
(+)-2-carene predicted by calculation in the gas phase in around a 1:2 ratio are also
present in the neat liquid, but with equivalent quantity. As a result determination
of the absolute configuration of (+)-2-carene is possible by comparison of experimental and calculated RoA spectra, with the latter being a sum of spectra of its two
stable conformers (see Fig. 4.6).
In conclusion to this section we can state that nowadays it is possible to calculate
routinely, and within a reasonable time, good quality RoA spectra for small and
medium size molecules [69, 70].
Fig. 4.5 optimized geometries of most stable conformers of (+)-2-carene (dFt/B3LYP/aug-ccpvtZ, gaussian ’09). the relative zero point corrected energy (in kJ mol
−1
) at 298.15 K is given
for each conformer
4 Raman optical Activity of Biological Samples