

499
16 Fourier Transform Infrared (Ft-Ir) Spectroscopic Imaging …
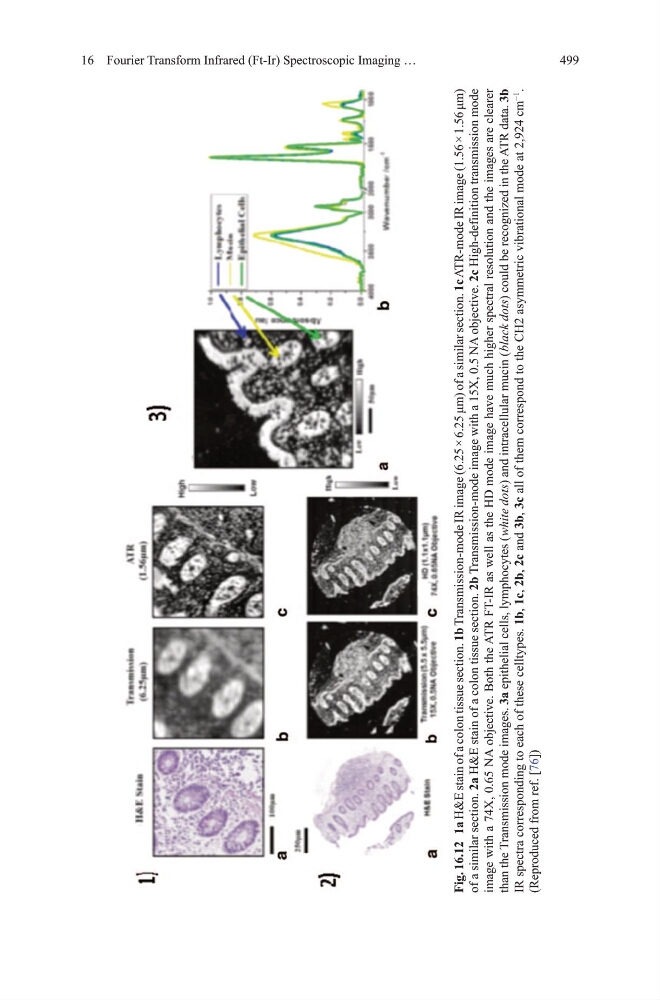
Fig. 16.12 1a h&E stain of a colon tissue section. 1b Transmission-mode IR image (6.25 × 6.25 μm) of a similar section. 1c ATR-mode IR image (1.56 × 1.56 μm)
of a similar section. 2a h&E stain of a colon tissue section. 2b transmission-mode image with a 15X, 0.5 NA objective. 2c high-definition transmission mode
image with
a 74X, 0.65 NA objective. Both the AtR Ft-IR as well as the hd mode image have much higher spectral resolution and the images are clearer
than the transmission mode images. 3a epithelial cells, lymphocytes ( white dots) and intracellular mucin ( black dots) could be recognized in the AtR data. 3b
IR spectra corresponding to each of these celltypes. 1b, 1c, 2b, 2c and 3b, 3c all of them correspond to the Ch2 asymmetric vibrational mode at 2,924 cm
−1
.
(Reproduced from ref. [76])
16 Fourier Transform Infrared (Ft-Ir) Spectroscopic Imaging …
Fig. 16.12 1a h&E stain of a colon tissue section. 1b Transmission-mode IR image (6.25 × 6.25 μm) of a similar section. 1c ATR-mode IR image (1.56 × 1.56 μm)
of a similar section. 2a h&E stain of a colon tissue section. 2b transmission-mode image with a 15X, 0.5 NA objective. 2c high-definition transmission mode
image with
a 74X, 0.65 NA objective. Both the AtR Ft-IR as well as the hd mode image have much higher spectral resolution and the images are clearer
than the transmission mode images. 3a epithelial cells, lymphocytes ( white dots) and intracellular mucin ( black dots) could be recognized in the AtR data. 3b
IR spectra corresponding to each of these celltypes. 1b, 1c, 2b, 2c and 3b, 3c all of them correspond to the Ch2 asymmetric vibrational mode at 2,924 cm
−1
.
(Reproduced from ref. [76])