

386
H. J. Byrne et al.
spectra of the nucleus and nucleoli, thus giving rise to a strong positive contribution to PC1, which differentiates between nucleus/nucleoli and cytoplasm 1. the
strongest variation, however, is the negative peak at 1,439 cm
−1
, which is prominent in the spectra of the L-α-Phosphatidylcholine and Sphingomyelin indicating
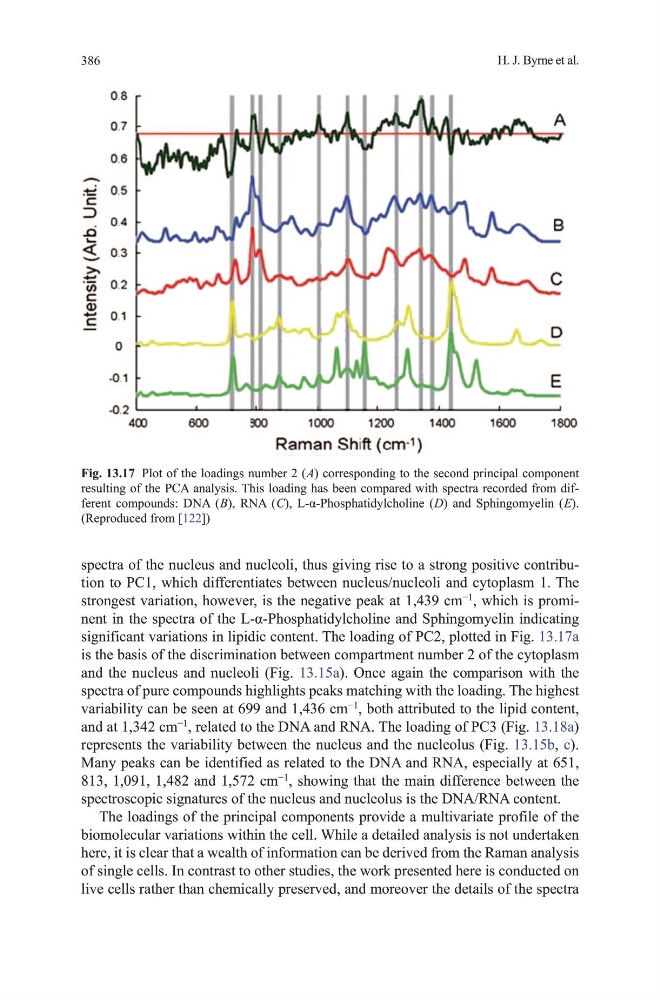
significant variations in lipidic content. the loading of PC2, plotted in Fig. 13.17a
is the basis of the discrimination between compartment number 2 of the cytoplasm
and the nucleus and nucleoli (Fig. 13.15a). once again the comparison with the
spectra of pure compounds highlights peaks matching with the loading. the highest
variability can be seen at 699 and 1,436 cm
−1
, both attributed to the lipid content,
and at 1,342 cm
−1
, related to the dNA and RNA. the loading of PC3 (Fig. 13.18a)
represents the variability between the nucleus and the nucleolus (Fig. 13.15b, c).
many peaks can be identified as related to the dNA and RNA, especially at 651,
813, 1,091, 1,482 and 1,572 cm
−1
, showing that the main difference between the
spectroscopic signatures of the nucleus and nucleolus is the dNA/RNA content.
the loadings of the principal components provide a multivariate profile of the
biomolecular variations within the cell. While a detailed analysis is not undertaken
here, it is clear that a wealth of information can be derived from the Raman analysis
of single cells. In contrast to other studies, the work presented here is conducted on
live cells rather than chemically preserved, and moreover the details of the spectra
Fig. 13.17 Plot of the loadings number 2 ( A) corresponding to the second principal component
resulting of the PCA analysis. this loading has been compared with spectra recorded from different compounds: dNA ( B), RNA ( C), L-α-Phosphatidylcholine ( D) and Sphingomyelin ( E).
(Reproduced from [122])
H. J. Byrne et al.
spectra of the nucleus and nucleoli, thus giving rise to a strong positive contribution to PC1, which differentiates between nucleus/nucleoli and cytoplasm 1. the
strongest variation, however, is the negative peak at 1,439 cm
−1
, which is prominent in the spectra of the L-α-Phosphatidylcholine and Sphingomyelin indicating
significant variations in lipidic content. the loading of PC2, plotted in Fig. 13.17a
is the basis of the discrimination between compartment number 2 of the cytoplasm
and the nucleus and nucleoli (Fig. 13.15a). once again the comparison with the
spectra of pure compounds highlights peaks matching with the loading. the highest
variability can be seen at 699 and 1,436 cm
−1
, both attributed to the lipid content,
and at 1,342 cm
−1
, related to the dNA and RNA. the loading of PC3 (Fig. 13.18a)
represents the variability between the nucleus and the nucleolus (Fig. 13.15b, c).
many peaks can be identified as related to the dNA and RNA, especially at 651,
813, 1,091, 1,482 and 1,572 cm
−1
, showing that the main difference between the
spectroscopic signatures of the nucleus and nucleolus is the dNA/RNA content.
the loadings of the principal components provide a multivariate profile of the
biomolecular variations within the cell. While a detailed analysis is not undertaken
here, it is clear that a wealth of information can be derived from the Raman analysis
of single cells. In contrast to other studies, the work presented here is conducted on
live cells rather than chemically preserved, and moreover the details of the spectra
Fig. 13.17 Plot of the loadings number 2 ( A) corresponding to the second principal component
resulting of the PCA analysis. this loading has been compared with spectra recorded from different compounds: dNA ( B), RNA ( C), L-α-Phosphatidylcholine ( D) and Sphingomyelin ( E).
(Reproduced from [122])