

385
13 Vibrational Spectroscopy: Disease Diagnostics and Beyond
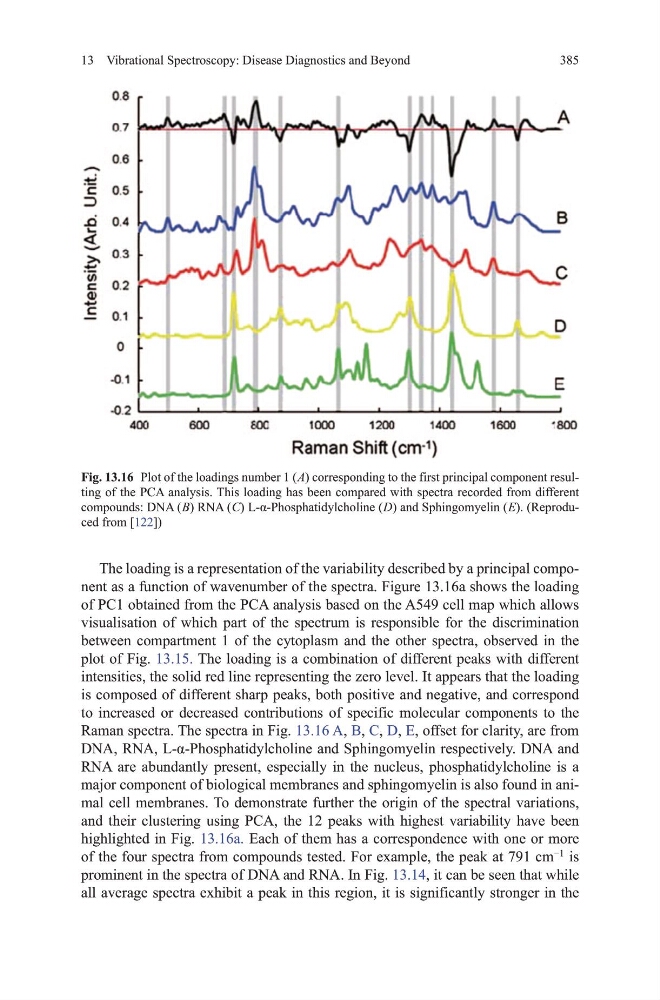
the loading is a representation of the variability described by a principal component as a function of wavenumber of the spectra. Figure 13.16a shows the loading
of PC1 obtained from the PCA analysis based on the A549 cell map which allows
visualisation of which part of the spectrum is responsible for the discrimination
between compartment 1 of the cytoplasm and the other spectra, observed in the
plot of Fig. 13.15. the loading is a combination of different peaks with different
intensities, the solid red line representing the zero level. It appears that the loading
is composed of different sharp peaks, both positive and negative, and correspond
to increased or decreased contributions of specific molecular components to the
Raman spectra. the spectra in Fig. 13.16 A, B, C, d, E, offset for clarity, are from
DNA, RNA, L-α-Phosphatidylcholine and Sphingomyelin respectively. DNA and
RNA are abundantly present, especially in the nucleus, phosphatidylcholine is a
major component of biological membranes and sphingomyelin is also found in animal cell membranes. to demonstrate further the origin of the spectral variations,
and their clustering using PCA, the 12 peaks with highest variability have been
highlighted in Fig. 13.16a. Each of them has a correspondence with one or more
of the four spectra from compounds tested. For example, the peak at 791 cm
−1
is
prominent in the spectra of dNA and RNA. In Fig. 13.14, it can be seen that while
all average spectra exhibit a peak in this region, it is significantly stronger in the
Fig. 13.16 Plot of the loadings number 1 ( A) corresponding to the first principal component resulting of the PCA analysis. this loading has been compared with spectra recorded from different
compounds: dNA ( B) RNA ( C) L-α-Phosphatidylcholine ( D) and Sphingomyelin ( E). (Reproduced from [122])
13 Vibrational Spectroscopy: Disease Diagnostics and Beyond
the loading is a representation of the variability described by a principal component as a function of wavenumber of the spectra. Figure 13.16a shows the loading
of PC1 obtained from the PCA analysis based on the A549 cell map which allows
visualisation of which part of the spectrum is responsible for the discrimination
between compartment 1 of the cytoplasm and the other spectra, observed in the
plot of Fig. 13.15. the loading is a combination of different peaks with different
intensities, the solid red line representing the zero level. It appears that the loading
is composed of different sharp peaks, both positive and negative, and correspond
to increased or decreased contributions of specific molecular components to the
Raman spectra. the spectra in Fig. 13.16 A, B, C, d, E, offset for clarity, are from
DNA, RNA, L-α-Phosphatidylcholine and Sphingomyelin respectively. DNA and
RNA are abundantly present, especially in the nucleus, phosphatidylcholine is a
major component of biological membranes and sphingomyelin is also found in animal cell membranes. to demonstrate further the origin of the spectral variations,
and their clustering using PCA, the 12 peaks with highest variability have been
highlighted in Fig. 13.16a. Each of them has a correspondence with one or more
of the four spectra from compounds tested. For example, the peak at 791 cm
−1
is
prominent in the spectra of dNA and RNA. In Fig. 13.14, it can be seen that while
all average spectra exhibit a peak in this region, it is significantly stronger in the
Fig. 13.16 Plot of the loadings number 1 ( A) corresponding to the first principal component resulting of the PCA analysis. this loading has been compared with spectra recorded from different
compounds: dNA ( B) RNA ( C) L-α-Phosphatidylcholine ( D) and Sphingomyelin ( E). (Reproduced from [122])