

384
H. J. Byrne et al.
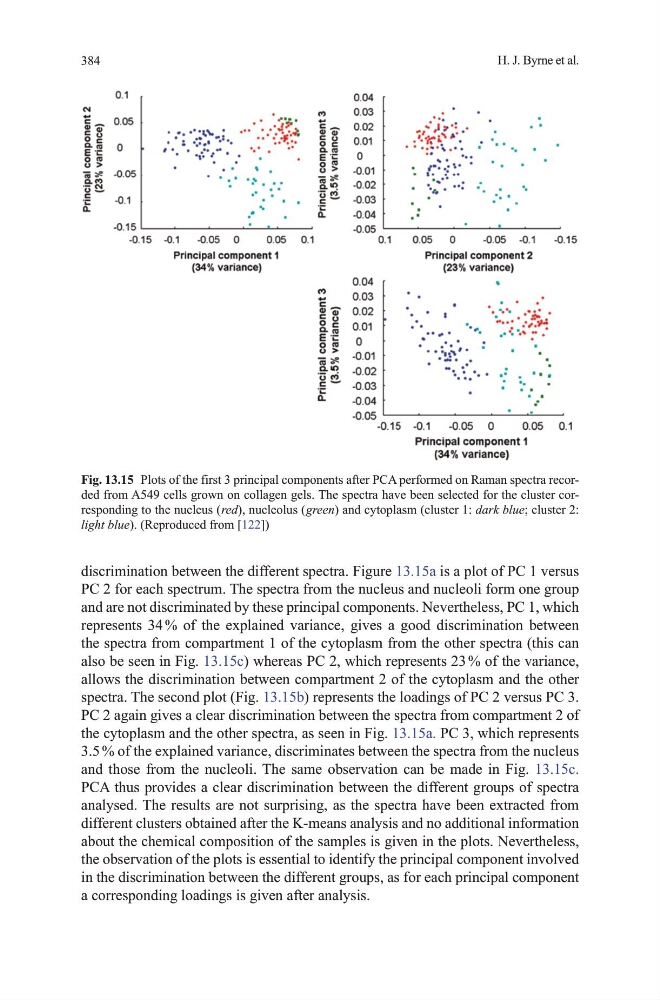
discrimination between the different spectra. Figure 13.15a is a plot of PC 1 versus
PC 2 for each spectrum. the spectra from the nucleus and nucleoli form one group
and are not discriminated by these principal components. Nevertheless, PC 1, which
represents 34 % of the explained variance, gives a good discrimination between
the spectra from compartment 1 of the cytoplasm from the other spectra (this can
also be seen in Fig. 13.15c) whereas PC 2, which represents 23 % of the variance,
allows the discrimination between compartment 2 of the cytoplasm and the other
spectra. the second plot (Fig. 13.15b) represents the loadings of PC 2 versus PC 3.
PC 2 again gives a clear discrimination between the spectra from compartment 2 of
the cytoplasm and the other spectra, as seen in Fig. 13.15a. PC 3, which represents
3.5 % of the explained variance, discriminates between the spectra from the nucleus
and those from the nucleoli. the same observation can be made in Fig. 13.15c.
PCA thus provides a clear discrimination between the different groups of spectra
analysed. the results are not surprising, as the spectra have been extracted from
different clusters obtained after the K-means analysis and no additional information
about the chemical composition of the samples is given in the plots. Nevertheless,
the observation of the plots is essential to identify the principal component involved
in the discrimination between the different groups, as for each principal component
a corresponding loadings is given after analysis.
Fig. 13.15 Plots of the first 3 principal components after PCA performed on Raman spectra recorded from A549 cells grown on collagen gels. the spectra have been selected for the cluster corresponding to the nucleus ( red), nucleolus ( green) and cytoplasm (cluster 1: dark blue; cluster 2:
light blue). (Reproduced from [122])
H. J. Byrne et al.
discrimination between the different spectra. Figure 13.15a is a plot of PC 1 versus
PC 2 for each spectrum. the spectra from the nucleus and nucleoli form one group
and are not discriminated by these principal components. Nevertheless, PC 1, which
represents 34 % of the explained variance, gives a good discrimination between
the spectra from compartment 1 of the cytoplasm from the other spectra (this can
also be seen in Fig. 13.15c) whereas PC 2, which represents 23 % of the variance,
allows the discrimination between compartment 2 of the cytoplasm and the other
spectra. the second plot (Fig. 13.15b) represents the loadings of PC 2 versus PC 3.
PC 2 again gives a clear discrimination between the spectra from compartment 2 of
the cytoplasm and the other spectra, as seen in Fig. 13.15a. PC 3, which represents
3.5 % of the explained variance, discriminates between the spectra from the nucleus
and those from the nucleoli. the same observation can be made in Fig. 13.15c.
PCA thus provides a clear discrimination between the different groups of spectra
analysed. the results are not surprising, as the spectra have been extracted from
different clusters obtained after the K-means analysis and no additional information
about the chemical composition of the samples is given in the plots. Nevertheless,
the observation of the plots is essential to identify the principal component involved
in the discrimination between the different groups, as for each principal component
a corresponding loadings is given after analysis.
Fig. 13.15 Plots of the first 3 principal components after PCA performed on Raman spectra recorded from A549 cells grown on collagen gels. the spectra have been selected for the cluster corresponding to the nucleus ( red), nucleolus ( green) and cytoplasm (cluster 1: dark blue; cluster 2:
light blue). (Reproduced from [122])