

383
13 Vibrational Spectroscopy: Disease Diagnostics and Beyond
cytoplasm will also contribute to the spectrum acquired. Similarly, the spectrum
of the cytoplasm will contain contributions from the overlying cellular membrane
and potentially also from subcellular organelles such as mitochondria, lysosomes,
etc. Across, the spectral range, the variations between the different regions are thus
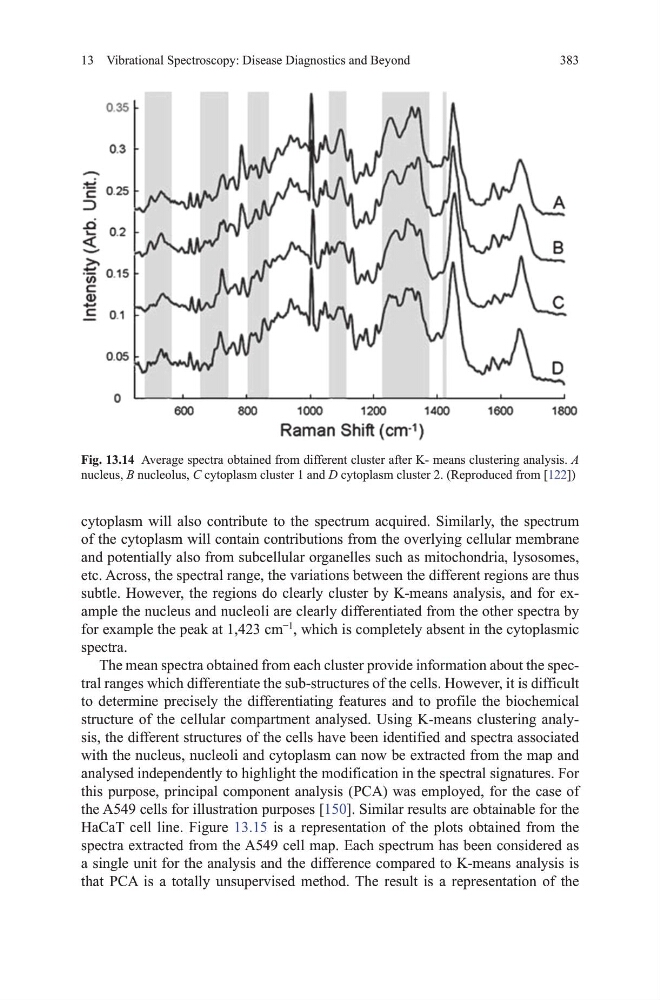
subtle. however, the regions do clearly cluster by K-means analysis, and for example the nucleus and nucleoli are clearly differentiated from the other spectra by
for example the peak at 1,423 cm
−1
, which is completely absent in the cytoplasmic
spectra.
the mean spectra obtained from each cluster provide information about the spectral ranges which differentiate the sub-structures of the cells. however, it is difficult
to determine precisely the differentiating features and to profile the biochemical
structure of the cellular compartment analysed. using K-means clustering analysis, the different structures of the cells have been identified and spectra associated
with the nucleus, nucleoli and cytoplasm can now be extracted from the map and
analysed independently to highlight the modification in the spectral signatures. For
this purpose, principal component analysis (PCA) was employed, for the case of
the A549 cells for illustration purposes [150]. Similar results are obtainable for the
haCat cell line. Figure 13.15 is a representation of the plots obtained from the
spectra extracted from the A549 cell map. Each spectrum has been considered as
a single unit for the analysis and the difference compared to K-means analysis is
that PCA is a totally unsupervised method. the result is a representation of the
Fig. 13.14 Average spectra obtained from different cluster after K- means clustering analysis. A
nucleus, B nucleolus, C cytoplasm cluster 1 and D cytoplasm cluster 2. (Reproduced from [122])
13 Vibrational Spectroscopy: Disease Diagnostics and Beyond
cytoplasm will also contribute to the spectrum acquired. Similarly, the spectrum
of the cytoplasm will contain contributions from the overlying cellular membrane
and potentially also from subcellular organelles such as mitochondria, lysosomes,
etc. Across, the spectral range, the variations between the different regions are thus
subtle. however, the regions do clearly cluster by K-means analysis, and for example the nucleus and nucleoli are clearly differentiated from the other spectra by
for example the peak at 1,423 cm
−1
, which is completely absent in the cytoplasmic
spectra.
the mean spectra obtained from each cluster provide information about the spectral ranges which differentiate the sub-structures of the cells. however, it is difficult
to determine precisely the differentiating features and to profile the biochemical
structure of the cellular compartment analysed. using K-means clustering analysis, the different structures of the cells have been identified and spectra associated
with the nucleus, nucleoli and cytoplasm can now be extracted from the map and
analysed independently to highlight the modification in the spectral signatures. For
this purpose, principal component analysis (PCA) was employed, for the case of
the A549 cells for illustration purposes [150]. Similar results are obtainable for the
haCat cell line. Figure 13.15 is a representation of the plots obtained from the
spectra extracted from the A549 cell map. Each spectrum has been considered as
a single unit for the analysis and the difference compared to K-means analysis is
that PCA is a totally unsupervised method. the result is a representation of the
Fig. 13.14 Average spectra obtained from different cluster after K- means clustering analysis. A
nucleus, B nucleolus, C cytoplasm cluster 1 and D cytoplasm cluster 2. (Reproduced from [122])