

369
13 Vibrational Spectroscopy: Disease Diagnostics and Beyond
lation between increasing grade of cervical lesion and staining intensity of p16
INK4A
was observed [81]. Similarly, Agoff et al. showed that p16
INK4A
expression correlates
with an increasing severity of cervical disease [82]. murphy et al. showed a strong
correlation between hR-hPv positivity and p16
INK4A
staining pattern [78, 83, 84]. In
the study conducted by Wang et al., a correlation between p16
INK4A
immunostaining
and cervical disease severity stratified by hPv status was observed [85].
the results demonstrate a correlation between p16
INK4A
immunostaining and
the presence of hPv in cervical cancer cell lines, supporting the previous studies
and implies that p16
INK4A
is a highly sensitive marker of hPv in cervical cancer
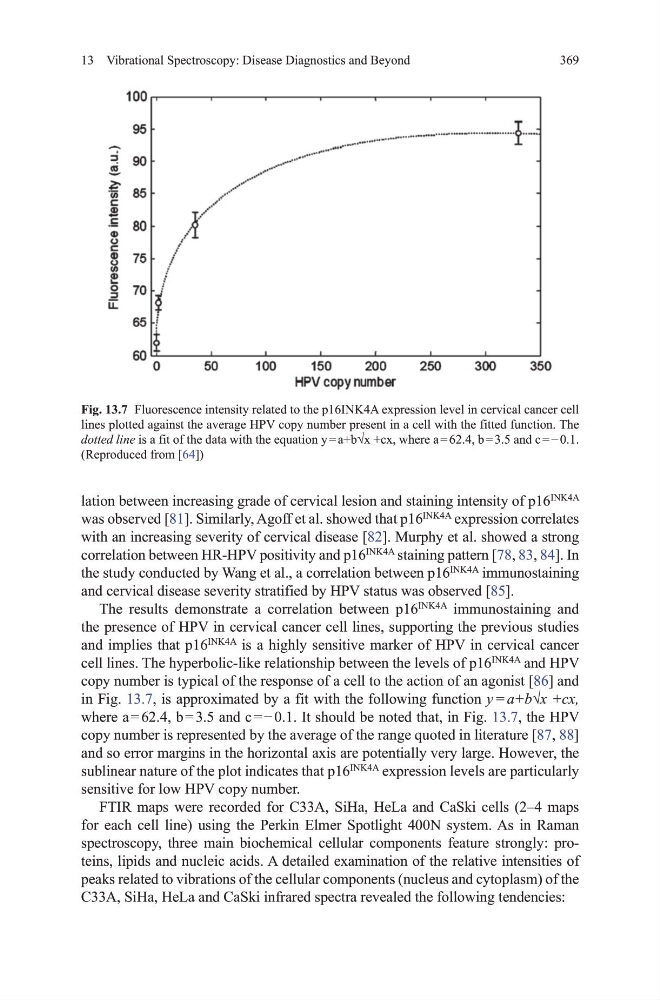
cell lines. the hyperbolic-like relationship between the levels of p16
INK4A
and hPv
copy number is typical of the response of a cell to the action of an agonist [86] and
in Fig. 13.7, is approximated by a fit with the following function y = a+b√x +cx,
where a = 62.4, b = 3.5 and c = − 0.1. It should be noted that, in Fig. 13.7, the hPv
copy number is represented by the average of the range quoted in literature [87, 88]
and so error margins in the horizontal axis are potentially very large. however, the
sublinear nature of the plot indicates that p16
INK4A
expression levels are particularly
sensitive for low hPv copy number.
FtIR maps were recorded for C33A, Siha, heLa and CaSki cells (2–4 maps
for each cell line) using the Perkin Elmer Spotlight 400N system. As in Raman
spectroscopy, three main biochemical cellular components feature strongly: proteins, lipids and nucleic acids. A detailed examination of the relative intensities of
peaks related to vibrations of the cellular components (nucleus and cytoplasm) of the
C33A, Siha, heLa and CaSki infrared spectra revealed the following tendencies:
Fig. 13.7 Fluorescence intensity related to the p16INK4A expression level in cervical cancer cell
lines plotted against the average hPv copy number present in a cell with the fitted function. the
dotted line is a fit of the data with the equation y = a+b√x +cx, where a = 62.4, b = 3.5 and c = − 0.1.
(Reproduced from [64])
13 Vibrational Spectroscopy: Disease Diagnostics and Beyond
lation between increasing grade of cervical lesion and staining intensity of p16
INK4A
was observed [81]. Similarly, Agoff et al. showed that p16
INK4A
expression correlates
with an increasing severity of cervical disease [82]. murphy et al. showed a strong
correlation between hR-hPv positivity and p16
INK4A
staining pattern [78, 83, 84]. In
the study conducted by Wang et al., a correlation between p16
INK4A
immunostaining
and cervical disease severity stratified by hPv status was observed [85].
the results demonstrate a correlation between p16
INK4A
immunostaining and
the presence of hPv in cervical cancer cell lines, supporting the previous studies
and implies that p16
INK4A
is a highly sensitive marker of hPv in cervical cancer
cell lines. the hyperbolic-like relationship between the levels of p16
INK4A
and hPv
copy number is typical of the response of a cell to the action of an agonist [86] and
in Fig. 13.7, is approximated by a fit with the following function y = a+b√x +cx,
where a = 62.4, b = 3.5 and c = − 0.1. It should be noted that, in Fig. 13.7, the hPv
copy number is represented by the average of the range quoted in literature [87, 88]
and so error margins in the horizontal axis are potentially very large. however, the
sublinear nature of the plot indicates that p16
INK4A
expression levels are particularly
sensitive for low hPv copy number.
FtIR maps were recorded for C33A, Siha, heLa and CaSki cells (2–4 maps
for each cell line) using the Perkin Elmer Spotlight 400N system. As in Raman
spectroscopy, three main biochemical cellular components feature strongly: proteins, lipids and nucleic acids. A detailed examination of the relative intensities of
peaks related to vibrations of the cellular components (nucleus and cytoplasm) of the
C33A, Siha, heLa and CaSki infrared spectra revealed the following tendencies:
Fig. 13.7 Fluorescence intensity related to the p16INK4A expression level in cervical cancer cell
lines plotted against the average hPv copy number present in a cell with the fitted function. the
dotted line is a fit of the data with the equation y = a+b√x +cx, where a = 62.4, b = 3.5 and c = − 0.1.
(Reproduced from [64])