

362
H. J. Byrne et al.
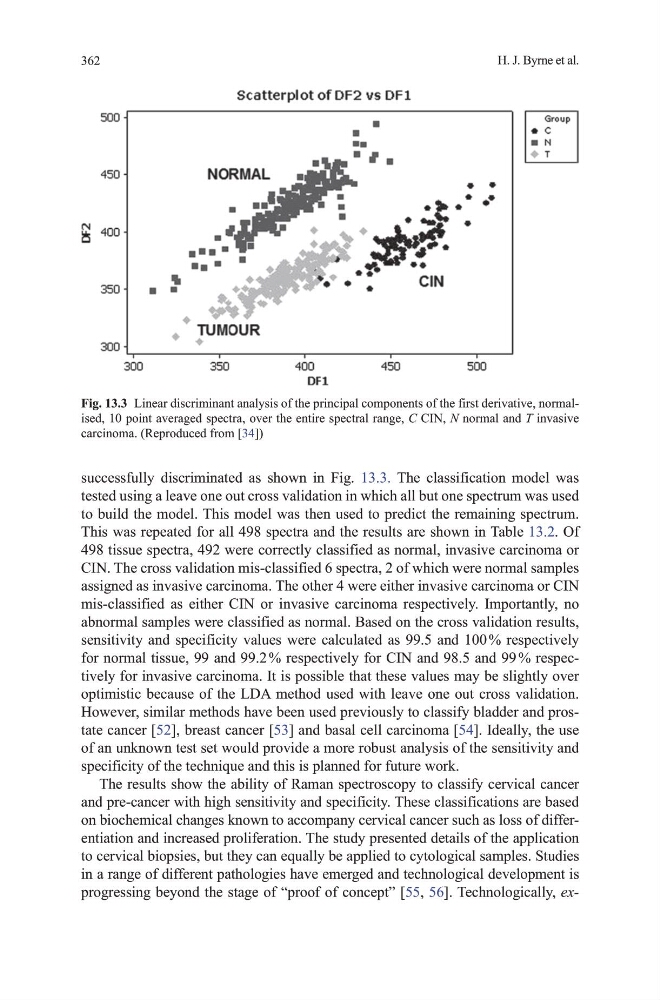
successfully discriminated as shown in Fig. 13.3. the classification model was
tested using a leave one out cross validation in which all but one spectrum was used
to build the model. this model was then used to predict the remaining spectrum.
this was repeated for all 498 spectra and the results are shown in table 13.2. of
498 tissue spectra, 492 were correctly classified as normal, invasive carcinoma or
CIN. the cross validation mis-classified 6 spectra, 2 of which were normal samples
assigned as invasive carcinoma. the other 4 were either invasive carcinoma or CIN
mis-classified as either CIN or invasive carcinoma respectively. Importantly, no
abnormal samples were classified as normal. Based on the cross validation results,
sensitivity and specificity values were calculated as 99.5 and 100 % respectively
for normal tissue, 99 and 99.2 % respectively for CIN and 98.5 and 99 % respectively for invasive carcinoma. It is possible that these values may be slightly over
optimistic because of the LdA method used with leave one out cross validation.
however, similar methods have been used previously to classify bladder and prostate cancer [52], breast cancer [53] and basal cell carcinoma [54]. Ideally, the use
of an unknown test set would provide a more robust analysis of the sensitivity and
specificity of the technique and this is planned for future work.
the results show the ability of Raman spectroscopy to classify cervical cancer
and pre-cancer with high sensitivity and specificity. these classifications are based
on biochemical changes known to accompany cervical cancer such as loss of differentiation and increased proliferation. the study presented details of the application
to cervical biopsies, but they can equally be applied to cytological samples. Studies
in a range of different pathologies have emerged and technological development is
progressing beyond the stage of “proof of concept” [55, 56]. technologically, exFig. 13.3 Linear discriminant analysis of the principal components of the first derivative, normalised, 10 point averaged spectra, over the entire spectral range, C CIN, N normal and T invasive
carcinoma. (Reproduced from [34])
H. J. Byrne et al.
successfully discriminated as shown in Fig. 13.3. the classification model was
tested using a leave one out cross validation in which all but one spectrum was used
to build the model. this model was then used to predict the remaining spectrum.
this was repeated for all 498 spectra and the results are shown in table 13.2. of
498 tissue spectra, 492 were correctly classified as normal, invasive carcinoma or
CIN. the cross validation mis-classified 6 spectra, 2 of which were normal samples
assigned as invasive carcinoma. the other 4 were either invasive carcinoma or CIN
mis-classified as either CIN or invasive carcinoma respectively. Importantly, no
abnormal samples were classified as normal. Based on the cross validation results,
sensitivity and specificity values were calculated as 99.5 and 100 % respectively
for normal tissue, 99 and 99.2 % respectively for CIN and 98.5 and 99 % respectively for invasive carcinoma. It is possible that these values may be slightly over
optimistic because of the LdA method used with leave one out cross validation.
however, similar methods have been used previously to classify bladder and prostate cancer [52], breast cancer [53] and basal cell carcinoma [54]. Ideally, the use
of an unknown test set would provide a more robust analysis of the sensitivity and
specificity of the technique and this is planned for future work.
the results show the ability of Raman spectroscopy to classify cervical cancer
and pre-cancer with high sensitivity and specificity. these classifications are based
on biochemical changes known to accompany cervical cancer such as loss of differentiation and increased proliferation. the study presented details of the application
to cervical biopsies, but they can equally be applied to cytological samples. Studies
in a range of different pathologies have emerged and technological development is
progressing beyond the stage of “proof of concept” [55, 56]. technologically, exFig. 13.3 Linear discriminant analysis of the principal components of the first derivative, normalised, 10 point averaged spectra, over the entire spectral range, C CIN, N normal and T invasive
carcinoma. (Reproduced from [34])