

361
13 Vibrational Spectroscopy: Disease Diagnostics and Beyond
acid bands. these include prominent bands at 724, 779 and 1,578 cm
−1
, but also at
829 cm
−1
, 852 cm
−1
, 1,002 cm
−1
, 1,098 cm
−1
, 1,240 cm
−1
. distinct bands are also
seen at 1,366 cm
−1
, a shoulder at 1,484 cm
−1
and a band at 1,578 cm
−1
. An increase
in the intensity of the Amide I band (1,655 cm
−1
) was observed in the spectra of carcinoma samples compared to the normal tissue samples. the increased nucleic acid
and protein bands are a result of the increased proliferation of these tumour cells.
to investigate whether pre-malignant changes can be elucidated using Raman
spectroscopy, 10 areas of CIN from 10 different patients were marked by the pathologist and a selection of the resulting Raman spectra are shown in Fig. 13.2b. A
number of the spectral features identified in the invasive carcinoma samples were
also observed in the CIN samples such as the nucleic acid bands at 724, 779, 852,
1,366 and 1,578 cm
−1
. this indicates that biochemical changes associated with CIN
can be identified using Raman spectroscopy.
Principal component analysis (PCA) is a method of multivariate analysis widely
used with datasets of multiple dimensions. PCA is a chemometric technique that can
resolve a complete spectral data set into a few principal components and can thus
identify and isolate important trends within the data set [50]. It allows the reduction
of the number of variables in a multidimensional dataset, although it retains most of
the variation within the dataset. the order of the PCs denotes their importance to the
dataset. PC 1 describes the highest amount of variation, PC 2 the second greatest and
so on. therefore, var (PC 1 ) ≥ var (PC 2 ) ≥ var (PC p ), where var (PC i ) represents the
variance of PC i in the considered data set. generally, the 3 first components represent
more than 90 % of the variance. this statistical method was preferred for this study to
highlight the variability existing in the spectral data set recorded during the different
experiments. Another advantage of this method is the observation of loadings which
represent the variance for each variable (wavenumber) for a given PC. Analysing the
loadings of a PC can give information about the source of the variability inside a data
set, derived from variations in the molecular components contributing to the spectra.
Principal component analysis was used to reduce the number of parameters needed to represent the variance in the spectral data set. the principal components were
then used to generate a linear discriminant model. LdA applies a linear discriminant
function that maximises the variance in the data between groups and minimises the
variance between members of the same group [51]. All three tissue classes were
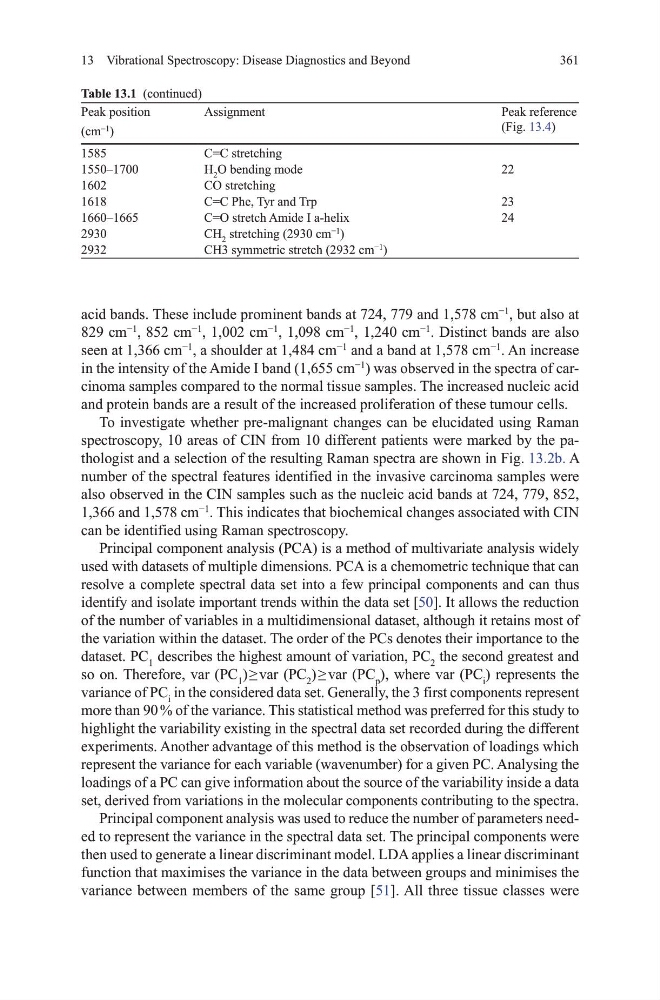
Peak position
(cm
-1
)
Assignment
Peak reference
(Fig. 13.4)
1585
C=C stretching
1550–1700
h 2 o bending mode
22
1602
Co stretching
1618
C=C Phe, tyr and trp
23
1660–1665
C=o stretch Amide I a-helix
24
2930
Ch 2 stretching (2930 cm
−1
)
2932
Ch3 symmetric stretch (2932 cm
−1
)
Table 13.1 (continued)
13 Vibrational Spectroscopy: Disease Diagnostics and Beyond
acid bands. these include prominent bands at 724, 779 and 1,578 cm
−1
, but also at
829 cm
−1
, 852 cm
−1
, 1,002 cm
−1
, 1,098 cm
−1
, 1,240 cm
−1
. distinct bands are also
seen at 1,366 cm
−1
, a shoulder at 1,484 cm
−1
and a band at 1,578 cm
−1
. An increase
in the intensity of the Amide I band (1,655 cm
−1
) was observed in the spectra of carcinoma samples compared to the normal tissue samples. the increased nucleic acid
and protein bands are a result of the increased proliferation of these tumour cells.
to investigate whether pre-malignant changes can be elucidated using Raman
spectroscopy, 10 areas of CIN from 10 different patients were marked by the pathologist and a selection of the resulting Raman spectra are shown in Fig. 13.2b. A
number of the spectral features identified in the invasive carcinoma samples were
also observed in the CIN samples such as the nucleic acid bands at 724, 779, 852,
1,366 and 1,578 cm
−1
. this indicates that biochemical changes associated with CIN
can be identified using Raman spectroscopy.
Principal component analysis (PCA) is a method of multivariate analysis widely
used with datasets of multiple dimensions. PCA is a chemometric technique that can
resolve a complete spectral data set into a few principal components and can thus
identify and isolate important trends within the data set [50]. It allows the reduction
of the number of variables in a multidimensional dataset, although it retains most of
the variation within the dataset. the order of the PCs denotes their importance to the
dataset. PC 1 describes the highest amount of variation, PC 2 the second greatest and
so on. therefore, var (PC 1 ) ≥ var (PC 2 ) ≥ var (PC p ), where var (PC i ) represents the
variance of PC i in the considered data set. generally, the 3 first components represent
more than 90 % of the variance. this statistical method was preferred for this study to
highlight the variability existing in the spectral data set recorded during the different
experiments. Another advantage of this method is the observation of loadings which
represent the variance for each variable (wavenumber) for a given PC. Analysing the
loadings of a PC can give information about the source of the variability inside a data
set, derived from variations in the molecular components contributing to the spectra.
Principal component analysis was used to reduce the number of parameters needed to represent the variance in the spectral data set. the principal components were
then used to generate a linear discriminant model. LdA applies a linear discriminant
function that maximises the variance in the data between groups and minimises the
variance between members of the same group [51]. All three tissue classes were
Peak position
(cm
-1
)
Assignment
Peak reference
(Fig. 13.4)
1585
C=C stretching
1550–1700
h 2 o bending mode
22
1602
Co stretching
1618
C=C Phe, tyr and trp
23
1660–1665
C=o stretch Amide I a-helix
24
2930
Ch 2 stretching (2930 cm
−1
)
2932
Ch3 symmetric stretch (2932 cm
−1
)
Table 13.1 (continued)