

340
Since the low frequency interval is considerably better, i.e., the spectra are more
distinguishable, it is of interest to further refine the structure of correlation for different parts of the spectra. Assuming that a 400 cm
−1
interval can be used for this
purpose, we define a series of windows of this width covering the whole interval
from 300 cm
−1
to 1700 cm
−1
by shifting them in 10 cm
−1
steps. For each window we
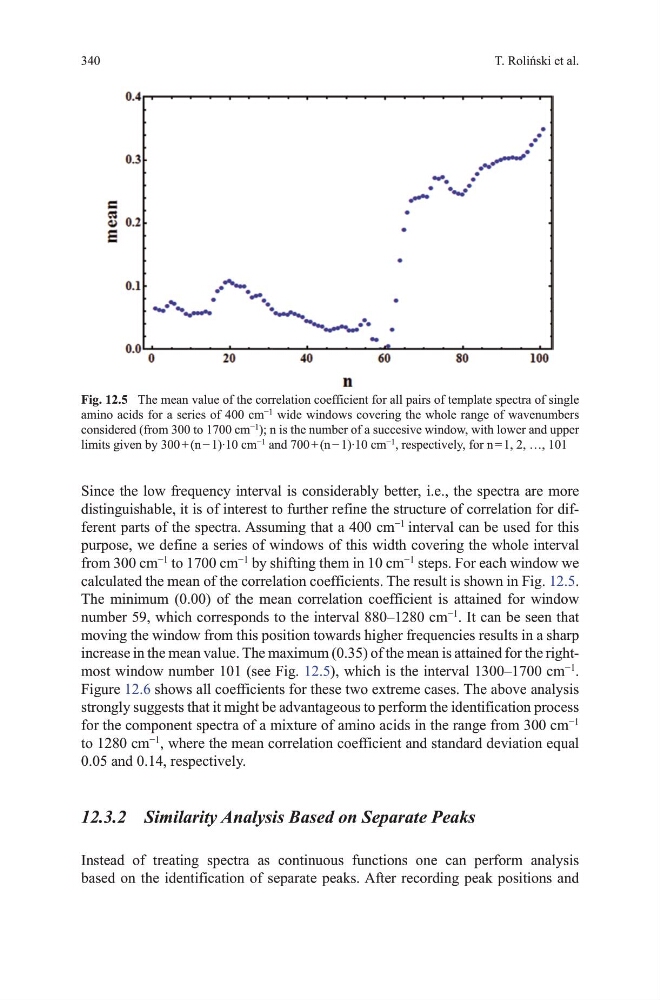
calculated the mean of the correlation coefficients. the result is shown in Fig. 12.5.
the minimum (0.00) of the mean correlation coefficient is attained for window
number 59, which corresponds to the interval 880–1280 cm
−1
. It can be seen that
moving the window from this position towards higher frequencies results in a sharp
increase in the mean value. the maximum (0.35) of the mean is attained for the rightmost window number 101 (see Fig. 12.5), which is the interval 1300–1700 cm
−1
.
Figure 12.6 shows all coefficients for these two extreme cases. the above analysis
strongly suggests that it might be advantageous to perform the identification process
for the component spectra of a mixture of amino acids in the range from 300 cm
−1
to 1280 cm
−1
, where the mean correlation coefficient and standard deviation equal
0.05 and 0.14, respectively.
12.3.2 Similarity Analysis Based on Separate Peaks
Instead of treating spectra as continuous functions one can perform analysis
based on the identification of separate peaks. After recording peak positions and
T. Roliński et al.
Fig. 12.5 the mean value of the correlation coefficient for all pairs of template spectra of single
amino acids for a series of 400 cm
−1
wide windows covering the whole range of wavenumbers
considered (from 300 to 1700 cm
−1
); n is the number of a succesive window, with lower and upper
limits given by 300 + (n − 1)·10 cm
−1
and 700 + (n − 1)·10 cm
−1
, respectively, for n = 1, 2, …, 101
Since the low frequency interval is considerably better, i.e., the spectra are more
distinguishable, it is of interest to further refine the structure of correlation for different parts of the spectra. Assuming that a 400 cm
−1
interval can be used for this
purpose, we define a series of windows of this width covering the whole interval
from 300 cm
−1
to 1700 cm
−1
by shifting them in 10 cm
−1
steps. For each window we
calculated the mean of the correlation coefficients. the result is shown in Fig. 12.5.
the minimum (0.00) of the mean correlation coefficient is attained for window
number 59, which corresponds to the interval 880–1280 cm
−1
. It can be seen that
moving the window from this position towards higher frequencies results in a sharp
increase in the mean value. the maximum (0.35) of the mean is attained for the rightmost window number 101 (see Fig. 12.5), which is the interval 1300–1700 cm
−1
.
Figure 12.6 shows all coefficients for these two extreme cases. the above analysis
strongly suggests that it might be advantageous to perform the identification process
for the component spectra of a mixture of amino acids in the range from 300 cm
−1
to 1280 cm
−1
, where the mean correlation coefficient and standard deviation equal
0.05 and 0.14, respectively.
12.3.2 Similarity Analysis Based on Separate Peaks
Instead of treating spectra as continuous functions one can perform analysis
based on the identification of separate peaks. After recording peak positions and
T. Roliński et al.
Fig. 12.5 the mean value of the correlation coefficient for all pairs of template spectra of single
amino acids for a series of 400 cm
−1
wide windows covering the whole range of wavenumbers
considered (from 300 to 1700 cm
−1
); n is the number of a succesive window, with lower and upper
limits given by 300 + (n − 1)·10 cm
−1
and 700 + (n − 1)·10 cm
−1
, respectively, for n = 1, 2, …, 101