

339
12 Raman Spectra of Solid Aminoacids: Spectral Correlation Analysis …
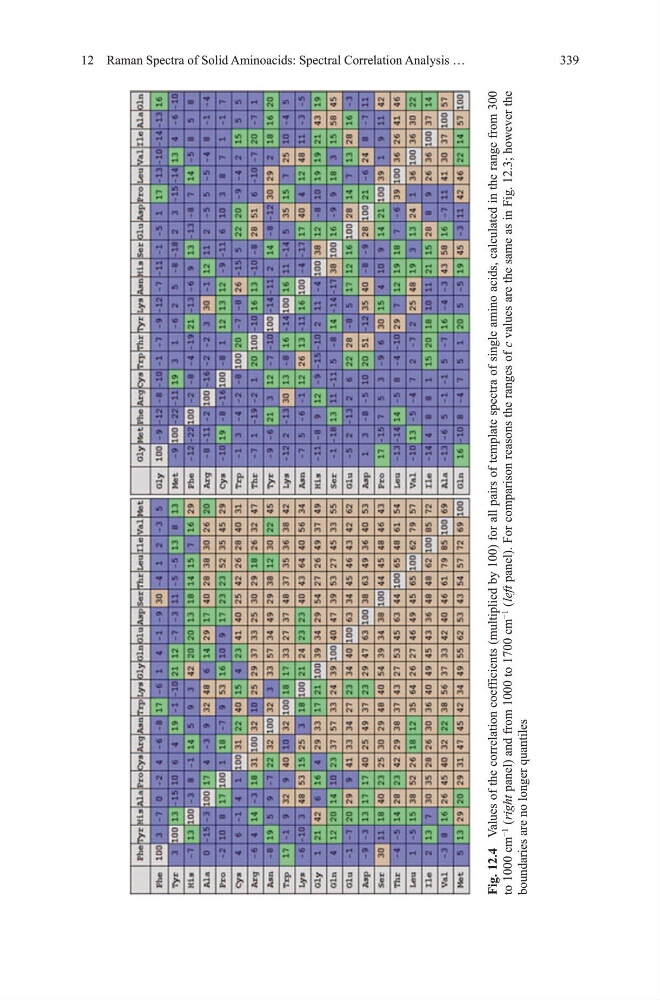
Fig. 12.4 values of the correlation coefficients (multiplied by 100) for all pairs of template spectra of single amino acids, calculated in the range from 300
to 1000
cm
−1
( right panel) and from 1000 to 1700 cm
−1
( left panel). For comparison reasons the ranges of c values are the same as in Fig. 12.3; however the
boundaries are no longer quantiles
12 Raman Spectra of Solid Aminoacids: Spectral Correlation Analysis …
Fig. 12.4 values of the correlation coefficients (multiplied by 100) for all pairs of template spectra of single amino acids, calculated in the range from 300
to 1000
cm
−1
( right panel) and from 1000 to 1700 cm
−1
( left panel). For comparison reasons the ranges of c values are the same as in Fig. 12.3; however the
boundaries are no longer quantiles