

338
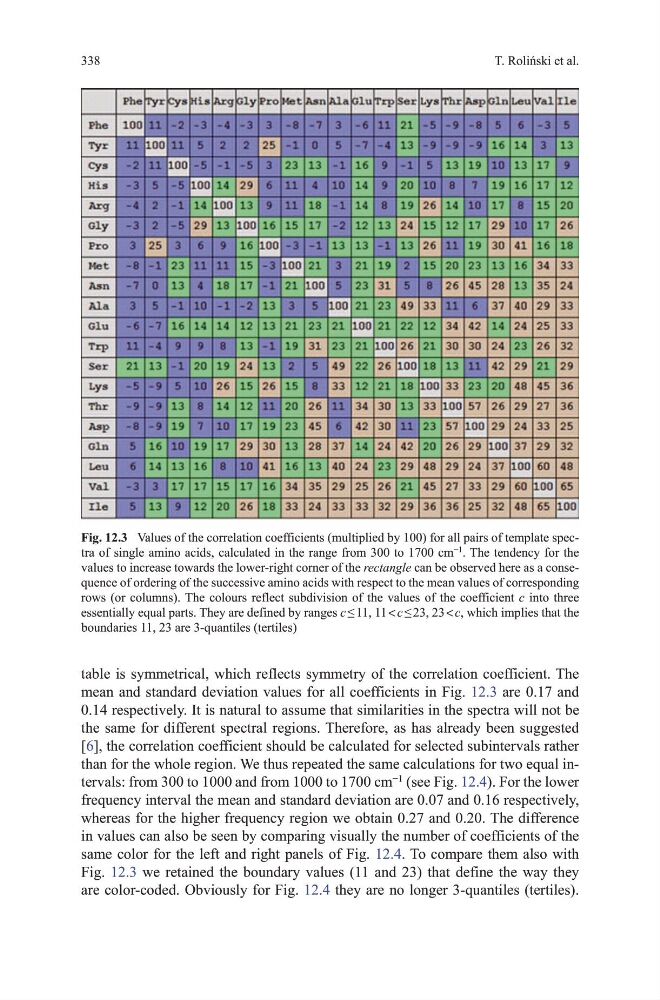
table is symmetrical, which reflects symmetry of the correlation coefficient. the
mean and standard deviation values for all coefficients in Fig. 12.3 are 0.17 and
0.14 respectively. It is natural to assume that similarities in the spectra will not be
the same for different spectral regions. therefore, as has already been suggested
[6], the correlation coefficient should be calculated for selected subintervals rather
than for the whole region. We thus repeated the same calculations for two equal intervals: from 300 to 1000 and from 1000 to 1700 cm
−1
(see Fig. 12.4). For the lower
frequency interval the mean and standard deviation are 0.07 and 0.16 respectively,
whereas for the higher frequency region we obtain 0.27 and 0.20. the difference
in values can also be seen by comparing visually the number of coefficients of the
same color for the left and right panels of Fig. 12.4. to compare them also with
Fig. 12.3 we retained the boundary values (11 and 23) that define the way they
are color-coded. obviously for Fig. 12.4 they are no longer 3-quantiles (tertiles).
Fig. 12.3 values of the correlation coefficients (multiplied by 100) for all pairs of template spectra of single amino acids, calculated in the range from 300 to 1700 cm
−1
. the tendency for the
values to increase towards the lower-right corner of the rectangle can be observed here as a consequence of ordering of the successive amino acids with respect to the mean values of corresponding
rows (or columns). the colours reflect subdivision of the values of the coefficient c into three
essentially equal parts. they are defined by ranges c ≤ 11, 11 < c ≤ 23, 23 < c, which implies that the
boundaries 11, 23 are 3-quantiles (tertiles)
T. Roliński et al.
table is symmetrical, which reflects symmetry of the correlation coefficient. the
mean and standard deviation values for all coefficients in Fig. 12.3 are 0.17 and
0.14 respectively. It is natural to assume that similarities in the spectra will not be
the same for different spectral regions. therefore, as has already been suggested
[6], the correlation coefficient should be calculated for selected subintervals rather
than for the whole region. We thus repeated the same calculations for two equal intervals: from 300 to 1000 and from 1000 to 1700 cm
−1
(see Fig. 12.4). For the lower
frequency interval the mean and standard deviation are 0.07 and 0.16 respectively,
whereas for the higher frequency region we obtain 0.27 and 0.20. the difference
in values can also be seen by comparing visually the number of coefficients of the
same color for the left and right panels of Fig. 12.4. to compare them also with
Fig. 12.3 we retained the boundary values (11 and 23) that define the way they
are color-coded. obviously for Fig. 12.4 they are no longer 3-quantiles (tertiles).
Fig. 12.3 values of the correlation coefficients (multiplied by 100) for all pairs of template spectra of single amino acids, calculated in the range from 300 to 1700 cm
−1
. the tendency for the
values to increase towards the lower-right corner of the rectangle can be observed here as a consequence of ordering of the successive amino acids with respect to the mean values of corresponding
rows (or columns). the colours reflect subdivision of the values of the coefficient c into three
essentially equal parts. they are defined by ranges c ≤ 11, 11 < c ≤ 23, 23 < c, which implies that the
boundaries 11, 23 are 3-quantiles (tertiles)
T. Roliński et al.