

341
12 Raman Spectra of Solid Aminoacids: Spectral Correlation Analysis …
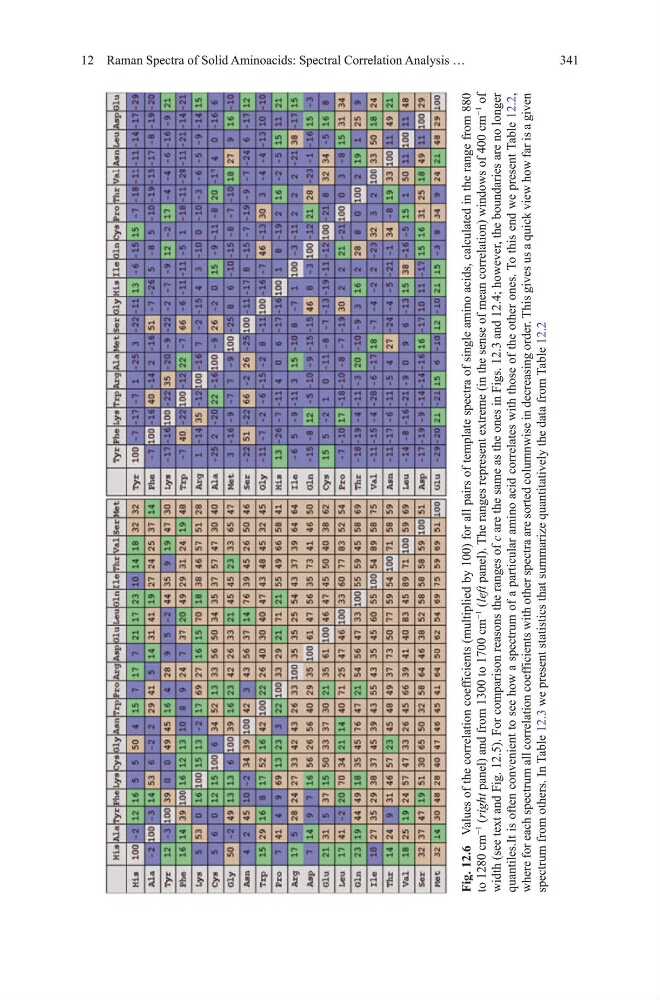
Fig. 12.6 values of the correlation coefficients (multiplied by 100) for all pairs of template spectra of single amino acids, calculated in the range from 880
to 1280
cm
−1
( right panel) and from 1300 to 1700 cm
−1
( left panel). the ranges represent extreme (in the sense of mean correlation) windows of 400 cm
−1
of
width (see text and Fig.
12.5). For comparison reasons the ranges of c are the same as the ones in Figs. 12.3 and 12.4; however, the boundaries are no longer
quantiles.It is often convenient to see how a spectrum of a particular amino acid correlates with those of the other ones. to this end we present table 12.2,
where for each spectrum all correlation coefficients with other spectra are sorted columnwise in decreasing order. this gives us a quick view how far is a given
spectrum from others. In
table 12.3 we present statistics that summarize quantitatively the data from table 12.2
12 Raman Spectra of Solid Aminoacids: Spectral Correlation Analysis …
Fig. 12.6 values of the correlation coefficients (multiplied by 100) for all pairs of template spectra of single amino acids, calculated in the range from 880
to 1280
cm
−1
( right panel) and from 1300 to 1700 cm
−1
( left panel). the ranges represent extreme (in the sense of mean correlation) windows of 400 cm
−1
of
width (see text and Fig.
12.5). For comparison reasons the ranges of c are the same as the ones in Figs. 12.3 and 12.4; however, the boundaries are no longer
quantiles.It is often convenient to see how a spectrum of a particular amino acid correlates with those of the other ones. to this end we present table 12.2,
where for each spectrum all correlation coefficients with other spectra are sorted columnwise in decreasing order. this gives us a quick view how far is a given
spectrum from others. In
table 12.3 we present statistics that summarize quantitatively the data from table 12.2