

K. Jagiełło et al.
22
2.3 Influence of Agregation on UV/Vis Spectrum—A
Case Study
Acridine belong to a group of polycyclic heteroaromatic compounds and exhibit a
broad spectrum of biological activity including antiprotozoal, antibacterial, antiviral and antitumor activity [7, 14]. Imidazoacridinones (IA) derivaties are a group
of acridine antitumor drugs synthesized in department of Pharmaceutical technology and Biochemistry, Gdańsk University of Technology. The biological activity
of the imidazoacridinones has now been extensively investigated. Published data
suggested that imidazoacridinone drugs are capable of binding physicochemically
to dNA [15, 16]. the nature of these investigation and their relevance to cytotoxic
and antitumor properties of IA remains unknown.
Imidazoacrinonones tend to aggregate in diluted solutions, leading to dimer formation, and sometimes even higher order aggregates. driving forces of this process
are hydrophobic interactions. Kinetic information of aggregation process are very
helpful to understand molecular interaction such as micelle formation of amphiphilic substances and the binding of small ligands to macromolecules [17–19]. In spite
of many studies, the mechanism of compounds self-aggregation seems to be not
fully understood because of the experimental conditions, which are different from
study to study.
the most useful method to check if some compounds self-aggregate in aqua solution is spectroscopic analysis with increasing drug concentration. the following procedure of results analysis may be used to study the aggregation of various derivatives.
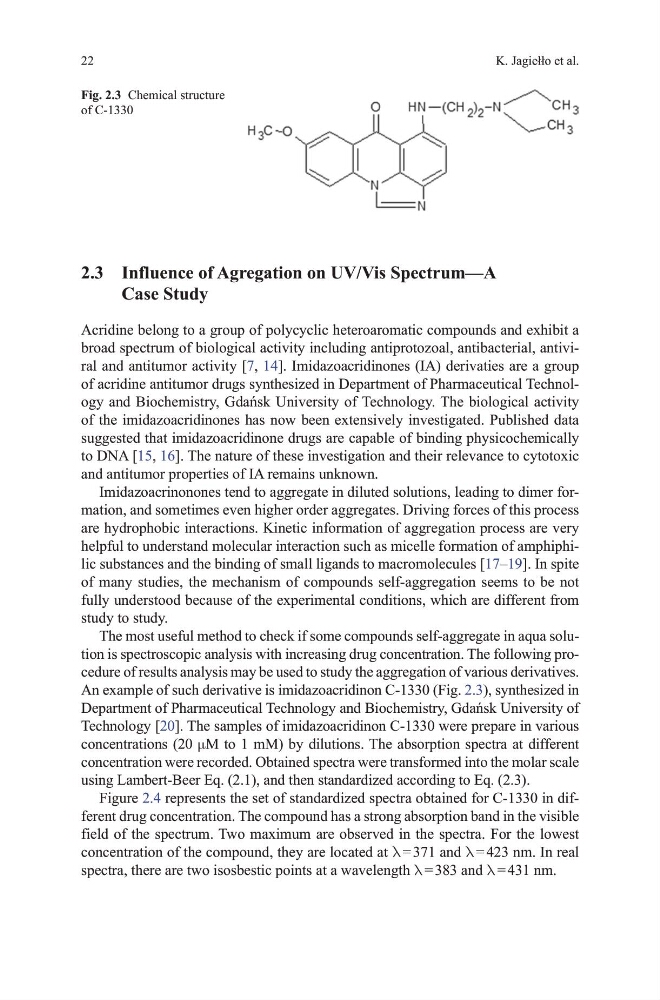
An example of such derivative is imidazoacridinon C-1330 (Fig. 2.3), synthesized in
Department of Pharmaceutical Technology and Biochemistry, Gdańsk University of
technology [20]. the samples of imidazoacridinon C-1330 were prepare in various
concentrations (20 µm to 1 mm) by dilutions. the absorption spectra at different
concentration were recorded. obtained spectra were transformed into the molar scale
using Lambert-Beer Eq. (2.1), and then standardized according to Eq. (2.3).
Figure 2.4 represents the set of standardized spectra obtained for C-1330 in different drug concentration. the compound has a strong absorption band in the visible
field of the spectrum. two maximum are observed in the spectra. For the lowest
concentration of the compound, they are located at λ = 371 and λ = 423 nm. In real
spectra, there are two isosbestic points at a wavelength λ = 383 and λ = 431 nm.
Fig. 2.3 Chemical structure
of C-1330
22
2.3 Influence of Agregation on UV/Vis Spectrum—A
Case Study
Acridine belong to a group of polycyclic heteroaromatic compounds and exhibit a
broad spectrum of biological activity including antiprotozoal, antibacterial, antiviral and antitumor activity [7, 14]. Imidazoacridinones (IA) derivaties are a group
of acridine antitumor drugs synthesized in department of Pharmaceutical technology and Biochemistry, Gdańsk University of Technology. The biological activity
of the imidazoacridinones has now been extensively investigated. Published data
suggested that imidazoacridinone drugs are capable of binding physicochemically
to dNA [15, 16]. the nature of these investigation and their relevance to cytotoxic
and antitumor properties of IA remains unknown.
Imidazoacrinonones tend to aggregate in diluted solutions, leading to dimer formation, and sometimes even higher order aggregates. driving forces of this process
are hydrophobic interactions. Kinetic information of aggregation process are very
helpful to understand molecular interaction such as micelle formation of amphiphilic substances and the binding of small ligands to macromolecules [17–19]. In spite
of many studies, the mechanism of compounds self-aggregation seems to be not
fully understood because of the experimental conditions, which are different from
study to study.
the most useful method to check if some compounds self-aggregate in aqua solution is spectroscopic analysis with increasing drug concentration. the following procedure of results analysis may be used to study the aggregation of various derivatives.
An example of such derivative is imidazoacridinon C-1330 (Fig. 2.3), synthesized in
Department of Pharmaceutical Technology and Biochemistry, Gdańsk University of
technology [20]. the samples of imidazoacridinon C-1330 were prepare in various
concentrations (20 µm to 1 mm) by dilutions. the absorption spectra at different
concentration were recorded. obtained spectra were transformed into the molar scale
using Lambert-Beer Eq. (2.1), and then standardized according to Eq. (2.3).
Figure 2.4 represents the set of standardized spectra obtained for C-1330 in different drug concentration. the compound has a strong absorption band in the visible
field of the spectrum. two maximum are observed in the spectra. For the lowest
concentration of the compound, they are located at λ = 371 and λ = 423 nm. In real
spectra, there are two isosbestic points at a wavelength λ = 383 and λ = 431 nm.
Fig. 2.3 Chemical structure
of C-1330