

2 Integrating Optical Spectroscopy and Chemometric Methods
23
Numerical analysis of the spectra for C-1330 was started by determining the
number of spectral forms present in the solution. table 2.2 presents the data obtained by using the PCA method. the following values suggest that the first two
principal components (explaining 99.99 % of the total variability) are significant.
Similar results were obtained after careful analysis of the residual spectra
(Fig. 2.5). the 1st and 2nd order residual spectra are relatively intensive and demonstrate the presence of absorption bands. Experimental noise prevails only in 3rd
or higher order residual spectra. this indicates that there are two spectral forms in
the solution: monomer and aggregate.
using the appropriate transformations as it was presented in Chap. 2.3. there
were possible to reproduce spectra of pure spectral forms. Figure 2.6 shows such
spectra for C-1330. the maximum absorption of the monomer occurs at 423 nm. In
the spectra of the aggregate exhibit characteristic batochromic effect with the maximum absorption at the 431 nm. the results of our studies indicate that the presence
as well as proportions of particular spectral forms is dependent on the overall concentration of studied compound.
Table 2.2 Eigen-values obtained for set of the C-1330 spectra
No of PC
1
2
3
4
5
Eigen-value
9.9827
0.0170
0.0002
0.0001
0.0000
% of variance
99.83
0.16
0.01
0.00
0.00
Cumulative % of variance 99.83
99.99
100.00
100.00
100.00
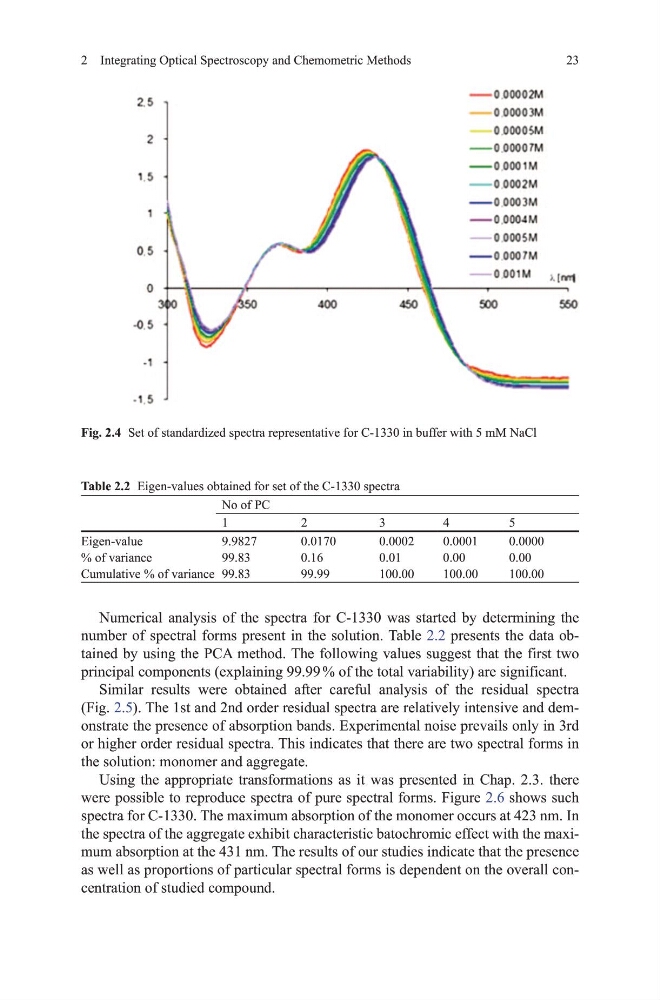
Fig. 2.4 Set of standardized spectra representative for C-1330 in buffer with 5 mm NaCl
23
Numerical analysis of the spectra for C-1330 was started by determining the
number of spectral forms present in the solution. table 2.2 presents the data obtained by using the PCA method. the following values suggest that the first two
principal components (explaining 99.99 % of the total variability) are significant.
Similar results were obtained after careful analysis of the residual spectra
(Fig. 2.5). the 1st and 2nd order residual spectra are relatively intensive and demonstrate the presence of absorption bands. Experimental noise prevails only in 3rd
or higher order residual spectra. this indicates that there are two spectral forms in
the solution: monomer and aggregate.
using the appropriate transformations as it was presented in Chap. 2.3. there
were possible to reproduce spectra of pure spectral forms. Figure 2.6 shows such
spectra for C-1330. the maximum absorption of the monomer occurs at 423 nm. In
the spectra of the aggregate exhibit characteristic batochromic effect with the maximum absorption at the 431 nm. the results of our studies indicate that the presence
as well as proportions of particular spectral forms is dependent on the overall concentration of studied compound.
Table 2.2 Eigen-values obtained for set of the C-1330 spectra
No of PC
1
2
3
4
5
Eigen-value
9.9827
0.0170
0.0002
0.0001
0.0000
% of variance
99.83
0.16
0.01
0.00
0.00
Cumulative % of variance 99.83
99.99
100.00
100.00
100.00
Fig. 2.4 Set of standardized spectra representative for C-1330 in buffer with 5 mm NaCl