

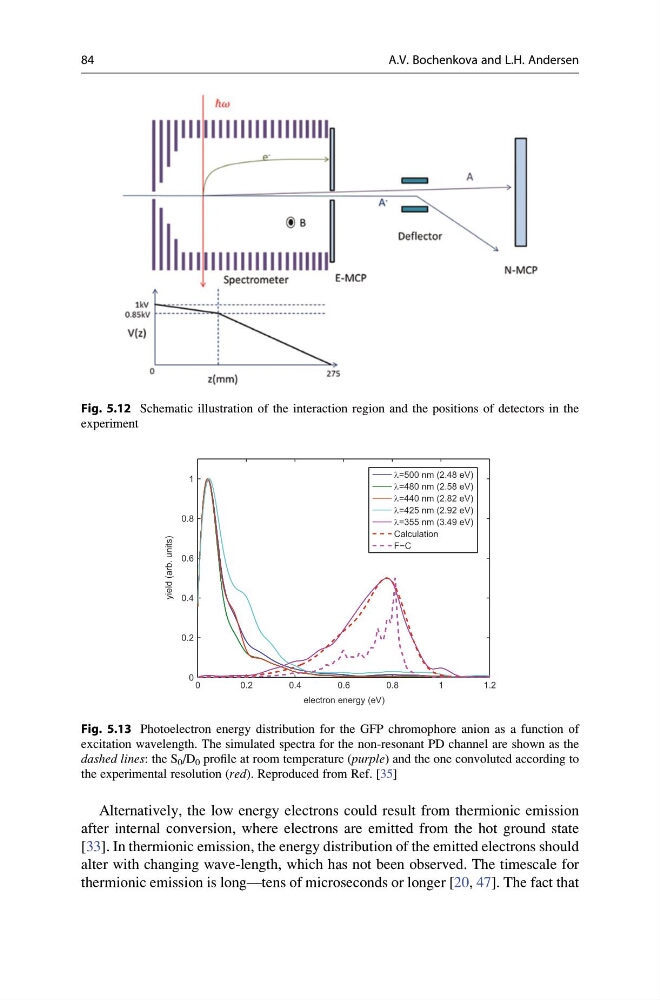
Alternatively, the low energy electrons could result from thermionic emission
after internal conversion, where electrons are emitted from the hot ground state
[33]. In thermionic emission, the energy distribution of the emitted electrons should
alter with changing wave-length, which has not been observed. The timescale for
thermionic emission is long—tens of microseconds or longer [20, 47]. The fact that
Fig. 5.12 Schematic illustration of the interaction region and the positions of detectors in the
experiment
0
0.2
0.4
0.6
0.8
1
1.2
0
0.2
0.4
0.6
0.8
1
electron energy (eV)
yield (arb. units)
λ=500 nm (2.48 eV)
λ=480 nm (2.58 eV)
λ=440 nm (2.82 eV)
λ=425 nm (2.92 eV)
λ=355 nm (3.49 eV)
Calculation
F−C
Fig. 5.13 Photoelectron energy distribution for the GFP chromophore anion as a function of
excitation wavelength. The simulated spectra for the non-resonant PD channel are shown as the
dashed lines: the S 0 /D 0 profile at room temperature (purple) and the one convoluted according to
the experimental resolution (red). Reproduced from Ref. [35]
84
A.V. Bochenkova and L.H. Andersen
after internal conversion, where electrons are emitted from the hot ground state
[33]. In thermionic emission, the energy distribution of the emitted electrons should
alter with changing wave-length, which has not been observed. The timescale for
thermionic emission is long—tens of microseconds or longer [20, 47]. The fact that
Fig. 5.12 Schematic illustration of the interaction region and the positions of detectors in the
experiment
0
0.2
0.4
0.6
0.8
1
1.2
0
0.2
0.4
0.6
0.8
1
electron energy (eV)
yield (arb. units)
λ=500 nm (2.48 eV)
λ=480 nm (2.58 eV)
λ=440 nm (2.82 eV)
λ=425 nm (2.92 eV)
λ=355 nm (3.49 eV)
Calculation
F−C
Fig. 5.13 Photoelectron energy distribution for the GFP chromophore anion as a function of
excitation wavelength. The simulated spectra for the non-resonant PD channel are shown as the
dashed lines: the S 0 /D 0 profile at room temperature (purple) and the one convoluted according to
the experimental resolution (red). Reproduced from Ref. [35]
84
A.V. Bochenkova and L.H. Andersen