

the dissociation of these cold radical cations occurs on too long time scales to be
measurable in the experiment at 270-nm excitation. In contrast, further dissociation
after hydrogen loss following 220-nm photoexcitation is more probable due to the
larger amount of energy deposited. To avoid such fast dissociation resulting from
the population of charge-transfer (CT) states causing prompt H loss, the excited
states of an ion can be manipulated by supramolecular complexation. For example,
complexes can be formed between ions and 18-crown-6 ether (CE) as CE targets
ammonium groups [12, 13]. Such a complexation can move the dissociative state
resulting in hydrogen loss out of the spectral region and instead measurable
statistical dissociation occurs on the microsecond to millisecond timescale
(Fig. 3.10). Another effect of the CE is to immobilise the proton thereby prohibiting
the facile cleavage of the peptide bond [14, 15] and slowing down the decay.
An interesting question is whether delayed dissociation due to statistical processes can account for the total ion beam depletion. The latter is easily calculated
from the count rate just before laser irradiation (CID only, n before ) and that right
after all the photoexcited ions have decayed (CID only, n after ). If the time constant
(τ) associated with CID is much longer than that for photodissociation (τ*) (see
Fig. 3.12), then the total beam depletion is simply 1 À
n after
n before
. For exponential decays,
the decay rate before photoexcitation is given as
N 0
τ exp À
t
τ
À Á
and that for photoexcitation is
N 0
Ã
τ Ã exp À
t
τ Ã
À
Á
, where N 0 is the total number of ions before photoexcitation,
and N 0 * is the total number of photoexcited ions. The depletion due to statistical
dissociation is then
N 0
Ã
N 0
¼
n
à t
ð Þ τ
Ã
n before τ exp
t
τ Ã
À Á
, for τ ) τ*, where n*(t) is the decay rate at
time t after photoexcitation. This procedure has been used in the case of AMP
anions and cations [16], see Chap. 10 by Weber, Marcum, and Brøndsted Nielsen.
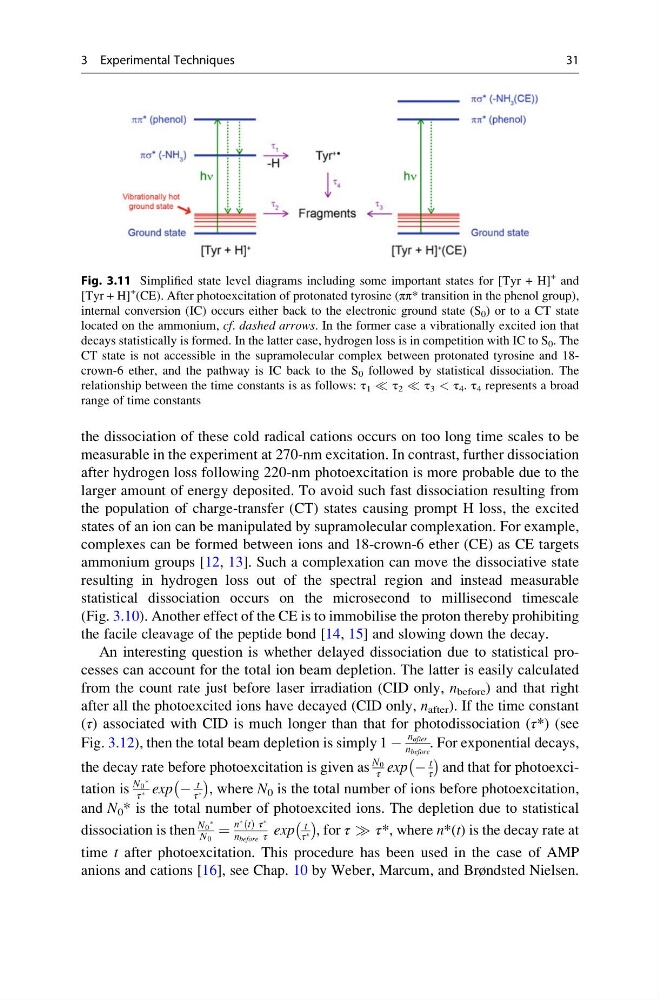
Fig. 3.11 Simplified state level diagrams including some important states for [Tyr + H]
+ and
[Tyr + H]
+ (CE). After photoexcitation of protonated tyrosine (ππ* transition in the phenol group),
internal conversion (IC) occurs either back to the electronic ground state (S 0 ) or to a CT state
located on the ammonium, cf. dashed arrows. In the former case a vibrationally excited ion that
decays statistically is formed. In the latter case, hydrogen loss is in competition with IC to S 0 . The
CT state is not accessible in the supramolecular complex between protonated tyrosine and 18crown-6 ether, and the pathway is IC back to the S 0 followed by statistical dissociation. The
relationship between the time constants is as follows: τ 1 ( τ 2 ( τ 3 < τ 4 . τ 4 represents a broad
range of time constants
3 Experimental Techniques
31
measurable in the experiment at 270-nm excitation. In contrast, further dissociation
after hydrogen loss following 220-nm photoexcitation is more probable due to the
larger amount of energy deposited. To avoid such fast dissociation resulting from
the population of charge-transfer (CT) states causing prompt H loss, the excited
states of an ion can be manipulated by supramolecular complexation. For example,
complexes can be formed between ions and 18-crown-6 ether (CE) as CE targets
ammonium groups [12, 13]. Such a complexation can move the dissociative state
resulting in hydrogen loss out of the spectral region and instead measurable
statistical dissociation occurs on the microsecond to millisecond timescale
(Fig. 3.10). Another effect of the CE is to immobilise the proton thereby prohibiting
the facile cleavage of the peptide bond [14, 15] and slowing down the decay.
An interesting question is whether delayed dissociation due to statistical processes can account for the total ion beam depletion. The latter is easily calculated
from the count rate just before laser irradiation (CID only, n before ) and that right
after all the photoexcited ions have decayed (CID only, n after ). If the time constant
(τ) associated with CID is much longer than that for photodissociation (τ*) (see
Fig. 3.12), then the total beam depletion is simply 1 À
n after
n before
. For exponential decays,
the decay rate before photoexcitation is given as
N 0
τ exp À
t
τ
À Á
and that for photoexcitation is
N 0
Ã
τ Ã exp À
t
τ Ã
À
Á
, where N 0 is the total number of ions before photoexcitation,
and N 0 * is the total number of photoexcited ions. The depletion due to statistical
dissociation is then
N 0
Ã
N 0
¼
n
à t
ð Þ τ
Ã
n before τ exp
t
τ Ã
À Á
, for τ ) τ*, where n*(t) is the decay rate at
time t after photoexcitation. This procedure has been used in the case of AMP
anions and cations [16], see Chap. 10 by Weber, Marcum, and Brøndsted Nielsen.
Fig. 3.11 Simplified state level diagrams including some important states for [Tyr + H]
+ and
[Tyr + H]
+ (CE). After photoexcitation of protonated tyrosine (ππ* transition in the phenol group),
internal conversion (IC) occurs either back to the electronic ground state (S 0 ) or to a CT state
located on the ammonium, cf. dashed arrows. In the former case a vibrationally excited ion that
decays statistically is formed. In the latter case, hydrogen loss is in competition with IC to S 0 . The
CT state is not accessible in the supramolecular complex between protonated tyrosine and 18crown-6 ether, and the pathway is IC back to the S 0 followed by statistical dissociation. The
relationship between the time constants is as follows: τ 1 ( τ 2 ( τ 3 < τ 4 . τ 4 represents a broad
range of time constants
3 Experimental Techniques
31