

of 4.77 eV. This energy is above the lowest electron-binding energy in the gramicidin dianion. Crossing from the electronic excited state to an auto-ionising state
leads to electron detachment (see Scheme 8.1) [16].
We observed that the electron detachment yield is linear as a function of both
laser power and irradiation time, showing that the electron loss results from the
absorption of a single photon. The electron detachment yield can be used to record
linear action spectra and monitor the excited electronic spectrum of the trapped
ions.
8.4
UV Spectroscopy of Protein Anions
We present the electronic spectra of gas-phase deprotonated proteins with different
charge states [18]. First results are reported for insulin [19]. Insulin is a small
protein which consists of 51 amino acids distributed in two chains (chain A with 21
amino acids and B with 30 amino acids) linked by two disulfide bonds with an extra
disulfide bond in chain A. Insulin contains four acidic [Glu] residues and four
tyrosines. As a comparison, the gas-phase spectrum for [Tyr+H]
+ is shown in
Fig. 8.4a and is dominated by one band at 275 nm. This band is due to the excitation
of π electrons within the phenol group. Action spectra for the [M-4H]
4À and
[M-6H]
6À insulin ions are compared in Fig. 8.4 and display similarities with the
tyrosine spectrum. The two curves are, however, spectrally shifted. This is due to a
change in the ionisation state of the chromophores [19]. This bathochromism
represents a signature of the ionisation state of tyrosine in a protein and was also
observed in solution for tyrosine-containing proteins. The red-shift reflects the
destabilisation of the molecular orbitals due to the negative charge on the phenolate
oxygen, leading to a smaller HOMO–LUMO gap in phenolate in comparison to
phenol.
UV-VIS
IC
IVR
S 0
S 1
fragmentaƟon
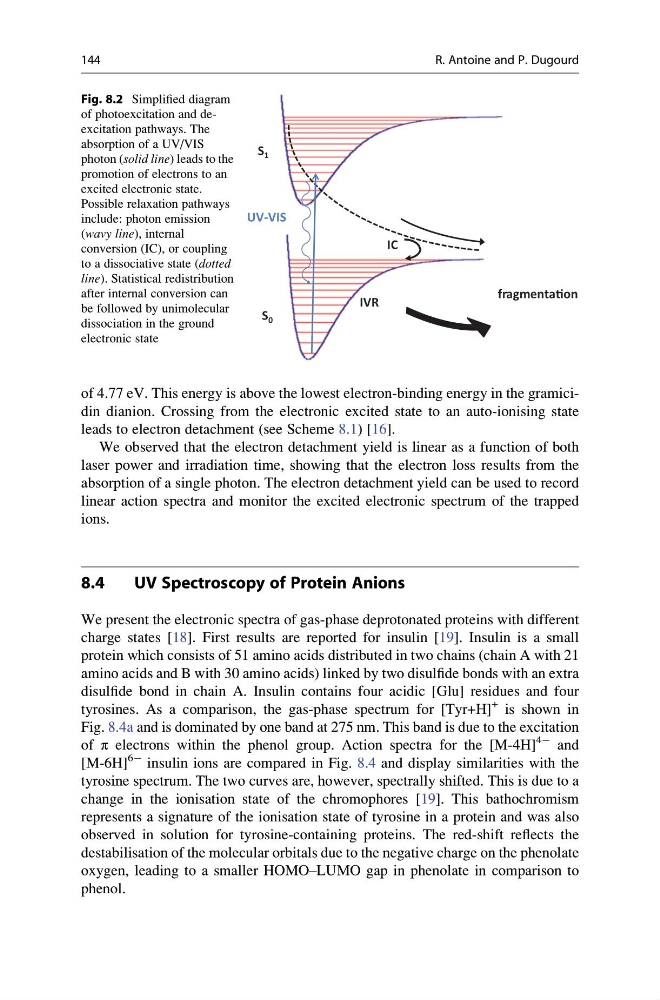
Fig. 8.2 Simplified diagram
of photoexcitation and deexcitation pathways. The
absorption of a UV/VIS
photon (solid line) leads to the
promotion of electrons to an
excited electronic state.
Possible relaxation pathways
include: photon emission
(wavy line), internal
conversion (IC), or coupling
to a dissociative state (dotted
line). Statistical redistribution
after internal conversion can
be followed by unimolecular
dissociation in the ground
electronic state
144
R. Antoine and P. Dugourd
leads to electron detachment (see Scheme 8.1) [16].
We observed that the electron detachment yield is linear as a function of both
laser power and irradiation time, showing that the electron loss results from the
absorption of a single photon. The electron detachment yield can be used to record
linear action spectra and monitor the excited electronic spectrum of the trapped
ions.
8.4
UV Spectroscopy of Protein Anions
We present the electronic spectra of gas-phase deprotonated proteins with different
charge states [18]. First results are reported for insulin [19]. Insulin is a small
protein which consists of 51 amino acids distributed in two chains (chain A with 21
amino acids and B with 30 amino acids) linked by two disulfide bonds with an extra
disulfide bond in chain A. Insulin contains four acidic [Glu] residues and four
tyrosines. As a comparison, the gas-phase spectrum for [Tyr+H]
+ is shown in
Fig. 8.4a and is dominated by one band at 275 nm. This band is due to the excitation
of π electrons within the phenol group. Action spectra for the [M-4H]
4À and
[M-6H]
6À insulin ions are compared in Fig. 8.4 and display similarities with the
tyrosine spectrum. The two curves are, however, spectrally shifted. This is due to a
change in the ionisation state of the chromophores [19]. This bathochromism
represents a signature of the ionisation state of tyrosine in a protein and was also
observed in solution for tyrosine-containing proteins. The red-shift reflects the
destabilisation of the molecular orbitals due to the negative charge on the phenolate
oxygen, leading to a smaller HOMO–LUMO gap in phenolate in comparison to
phenol.
UV-VIS
IC
IVR
S 0
S 1
fragmentaƟon
Fig. 8.2 Simplified diagram
of photoexcitation and deexcitation pathways. The
absorption of a UV/VIS
photon (solid line) leads to the
promotion of electrons to an
excited electronic state.
Possible relaxation pathways
include: photon emission
(wavy line), internal
conversion (IC), or coupling
to a dissociative state (dotted
line). Statistical redistribution
after internal conversion can
be followed by unimolecular
dissociation in the ground
electronic state
144
R. Antoine and P. Dugourd