

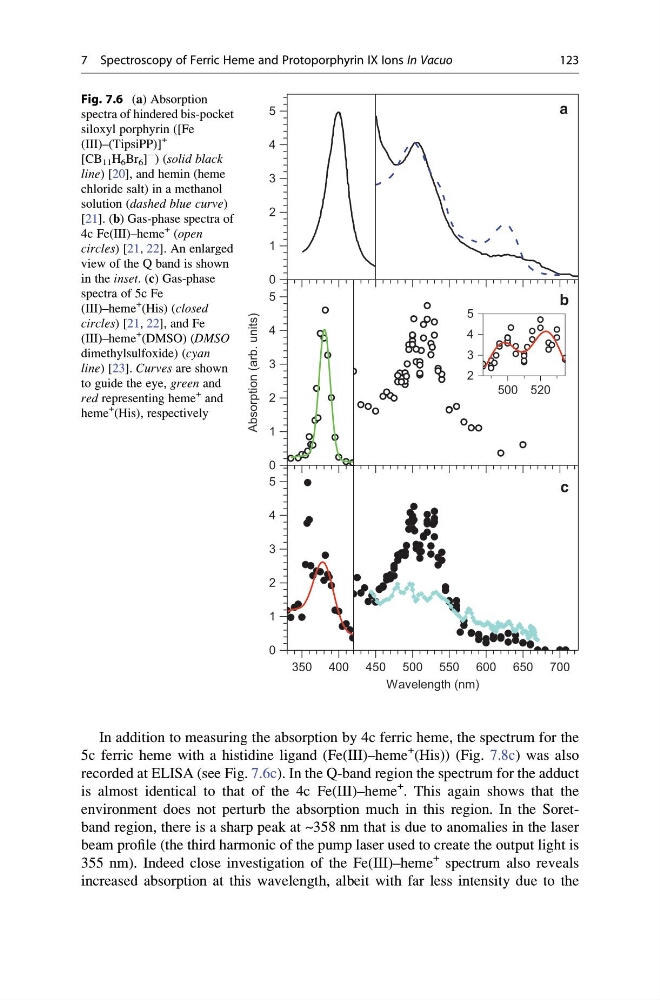
In addition to measuring the absorption by 4c ferric heme, the spectrum for the
5c ferric heme with a histidine ligand (Fe(III)–heme
+
(His)) (Fig. 7.8c) was also
recorded at ELISA (see Fig. 7.6c). In the Q-band region the spectrum for the adduct
is almost identical to that of the 4c Fe(III)–heme
+
. This again shows that the
environment does not perturb the absorption much in this region. In the Soretband region, there is a sharp peak at ~358 nm that is due to anomalies in the laser
beam profile (the third harmonic of the pump laser used to create the output light is
355 nm). Indeed close investigation of the Fe(III)–heme
+ spectrum also reveals
increased absorption at this wavelength, albeit with far less intensity due to the
c
0
1
2
3
4
5
Wavelength (nm)
350 400 450 500 550 600 650 700
0
1
2
3
4
5
0
1
2
3
4
5
a
b
500 520
2
3
4
5
Absorption (arb. units)
Fig. 7.6 (a) Absorption
spectra of hindered bis-pocket
siloxyl porphyrin ([Fe
(III)–(TipsiPP)]
+
[CB 11 H 6 Br 6 ]
À
) (solid black
line) [20], and hemin (heme
chloride salt) in a methanol
solution (dashed blue curve)
[21]. (b) Gas-phase spectra of
4c Fe(III)–heme
+ (open
circles) [21, 22]. An enlarged
view of the Q band is shown
in the inset. (c) Gas-phase
spectra of 5c Fe
(III)–heme
+ (His) (closed
circles) [21, 22], and Fe
(III)–heme
+ (DMSO) (DMSO
dimethylsulfoxide) (cyan
line) [23]. Curves are shown
to guide the eye, green and
red representing heme
+ and
heme
+ (His), respectively
7 Spectroscopy of Ferric Heme and Protoporphyrin IX Ions In Vacuo
123
5c ferric heme with a histidine ligand (Fe(III)–heme
+
(His)) (Fig. 7.8c) was also
recorded at ELISA (see Fig. 7.6c). In the Q-band region the spectrum for the adduct
is almost identical to that of the 4c Fe(III)–heme
+
. This again shows that the
environment does not perturb the absorption much in this region. In the Soretband region, there is a sharp peak at ~358 nm that is due to anomalies in the laser
beam profile (the third harmonic of the pump laser used to create the output light is
355 nm). Indeed close investigation of the Fe(III)–heme
+ spectrum also reveals
increased absorption at this wavelength, albeit with far less intensity due to the
c
0
1
2
3
4
5
Wavelength (nm)
350 400 450 500 550 600 650 700
0
1
2
3
4
5
0
1
2
3
4
5
a
b
500 520
2
3
4
5
Absorption (arb. units)
Fig. 7.6 (a) Absorption
spectra of hindered bis-pocket
siloxyl porphyrin ([Fe
(III)–(TipsiPP)]
+
[CB 11 H 6 Br 6 ]
À
) (solid black
line) [20], and hemin (heme
chloride salt) in a methanol
solution (dashed blue curve)
[21]. (b) Gas-phase spectra of
4c Fe(III)–heme
+ (open
circles) [21, 22]. An enlarged
view of the Q band is shown
in the inset. (c) Gas-phase
spectra of 5c Fe
(III)–heme
+ (His) (closed
circles) [21, 22], and Fe
(III)–heme
+ (DMSO) (DMSO
dimethylsulfoxide) (cyan
line) [23]. Curves are shown
to guide the eye, green and
red representing heme
+ and
heme
+ (His), respectively
7 Spectroscopy of Ferric Heme and Protoporphyrin IX Ions In Vacuo
123