

15 Cooperative Effects in Plasmonics
539
(a)
(b)
(c)
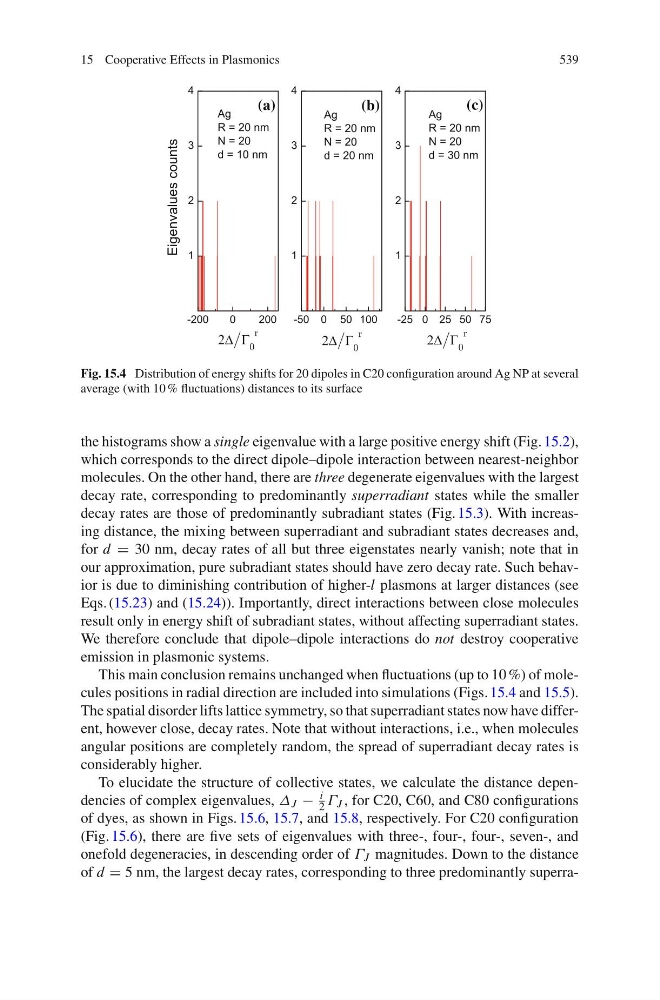
Fig. 15.4 Distribution of energy shifts for 20 dipoles in C20 configuration around Ag NP at several
average (with 10 % fluctuations) distances to its surface
the histograms show a single eigenvalue with a large positive energy shift (Fig. 15.2),
which corresponds to the direct dipole–dipole interaction between nearest-neighbor
molecules. On the other hand, there are three degenerate eigenvalues with the largest
decay rate, corresponding to predominantly superradiant states while the smaller
decay rates are those of predominantly subradiant states (Fig. 15.3). With increasing distance, the mixing between superradiant and subradiant states decreases and,
for d = 30 nm, decay rates of all but three eigenstates nearly vanish; note that in
our approximation, pure subradiant states should have zero decay rate. Such behavior is due to diminishing contribution of higher-l plasmons at larger distances (see
Eqs. (15.23) and (15.24)). Importantly, direct interactions between close molecules
result only in energy shift of subradiant states, without affecting superradiant states.
We therefore conclude that dipole–dipole interactions do not destroy cooperative
emission in plasmonic systems.
This main conclusion remains unchanged when fluctuations (up to 10 %) of molecules positions in radial direction are included into simulations (Figs. 15.4 and 15.5).
The spatial disorder lifts lattice symmetry, so that superradiant states now have different, however close, decay rates. Note that without interactions, i.e., when molecules
angular positions are completely random, the spread of superradiant decay rates is
considerably higher.
To elucidate the structure of collective states, we calculate the distance dependencies of complex eigenvalues, Δ J −
i
2 Γ J , for C20, C60, and C80 configurations
of dyes, as shown in Figs. 15.6, 15.7, and 15.8, respectively. For C20 configuration
(Fig. 15.6), there are five sets of eigenvalues with three-, four-, four-, seven-, and
onefold degeneracies, in descending order of Γ J magnitudes. Down to the distance
of d = 5 nm, the largest decay rates, corresponding to three predominantly superra-
539
(a)
(b)
(c)
Fig. 15.4 Distribution of energy shifts for 20 dipoles in C20 configuration around Ag NP at several
average (with 10 % fluctuations) distances to its surface
the histograms show a single eigenvalue with a large positive energy shift (Fig. 15.2),
which corresponds to the direct dipole–dipole interaction between nearest-neighbor
molecules. On the other hand, there are three degenerate eigenvalues with the largest
decay rate, corresponding to predominantly superradiant states while the smaller
decay rates are those of predominantly subradiant states (Fig. 15.3). With increasing distance, the mixing between superradiant and subradiant states decreases and,
for d = 30 nm, decay rates of all but three eigenstates nearly vanish; note that in
our approximation, pure subradiant states should have zero decay rate. Such behavior is due to diminishing contribution of higher-l plasmons at larger distances (see
Eqs. (15.23) and (15.24)). Importantly, direct interactions between close molecules
result only in energy shift of subradiant states, without affecting superradiant states.
We therefore conclude that dipole–dipole interactions do not destroy cooperative
emission in plasmonic systems.
This main conclusion remains unchanged when fluctuations (up to 10 %) of molecules positions in radial direction are included into simulations (Figs. 15.4 and 15.5).
The spatial disorder lifts lattice symmetry, so that superradiant states now have different, however close, decay rates. Note that without interactions, i.e., when molecules
angular positions are completely random, the spread of superradiant decay rates is
considerably higher.
To elucidate the structure of collective states, we calculate the distance dependencies of complex eigenvalues, Δ J −
i
2 Γ J , for C20, C60, and C80 configurations
of dyes, as shown in Figs. 15.6, 15.7, and 15.8, respectively. For C20 configuration
(Fig. 15.6), there are five sets of eigenvalues with three-, four-, four-, seven-, and
onefold degeneracies, in descending order of Γ J magnitudes. Down to the distance
of d = 5 nm, the largest decay rates, corresponding to three predominantly superra-