

538
V. N. Pustovit and T. V. Shahbazyan
(a)
(b)
(c)
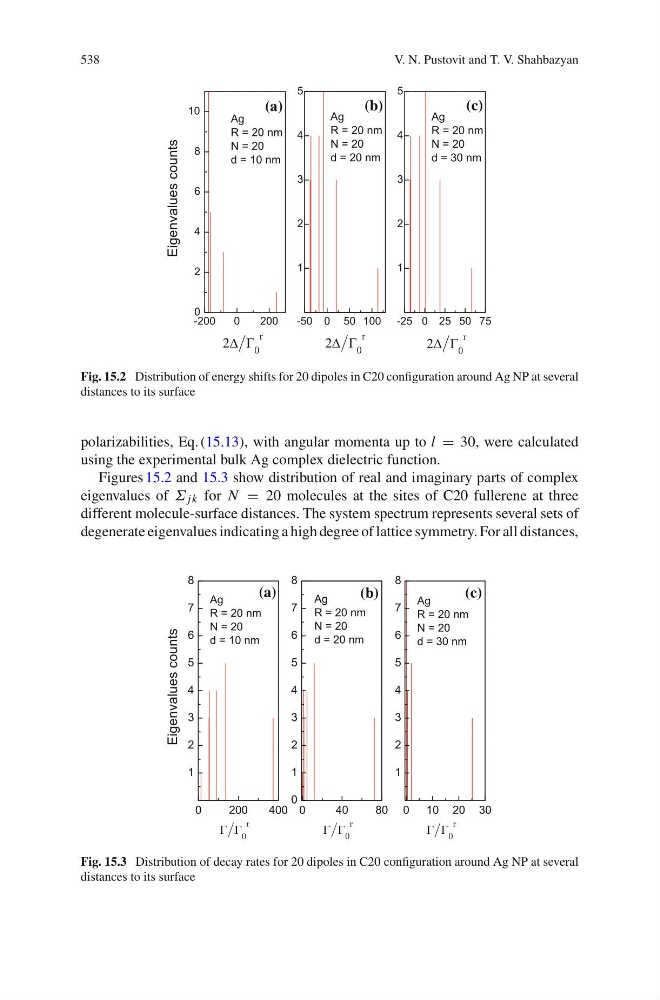
Fig. 15.2 Distribution of energy shifts for 20 dipoles in C20 configuration around Ag NP at several
distances to its surface
polarizabilities, Eq. (15.13), with angular momenta up to l = 30, were calculated
using the experimental bulk Ag complex dielectric function.
Figures 15.2 and 15.3 show distribution of real and imaginary parts of complex
eigenvalues of Σ jk for N = 20 molecules at the sites of C20 fullerene at three
different molecule-surface distances. The system spectrum represents several sets of
degenerate eigenvalues indicating a high degree of lattice symmetry. For all distances,
(a)
(b)
(c)
Fig. 15.3 Distribution of decay rates for 20 dipoles in C20 configuration around Ag NP at several
distances to its surface
V. N. Pustovit and T. V. Shahbazyan
(a)
(b)
(c)
Fig. 15.2 Distribution of energy shifts for 20 dipoles in C20 configuration around Ag NP at several
distances to its surface
polarizabilities, Eq. (15.13), with angular momenta up to l = 30, were calculated
using the experimental bulk Ag complex dielectric function.
Figures 15.2 and 15.3 show distribution of real and imaginary parts of complex
eigenvalues of Σ jk for N = 20 molecules at the sites of C20 fullerene at three
different molecule-surface distances. The system spectrum represents several sets of
degenerate eigenvalues indicating a high degree of lattice symmetry. For all distances,
(a)
(b)
(c)
Fig. 15.3 Distribution of decay rates for 20 dipoles in C20 configuration around Ag NP at several
distances to its surface