

516
F. Gentile et al.
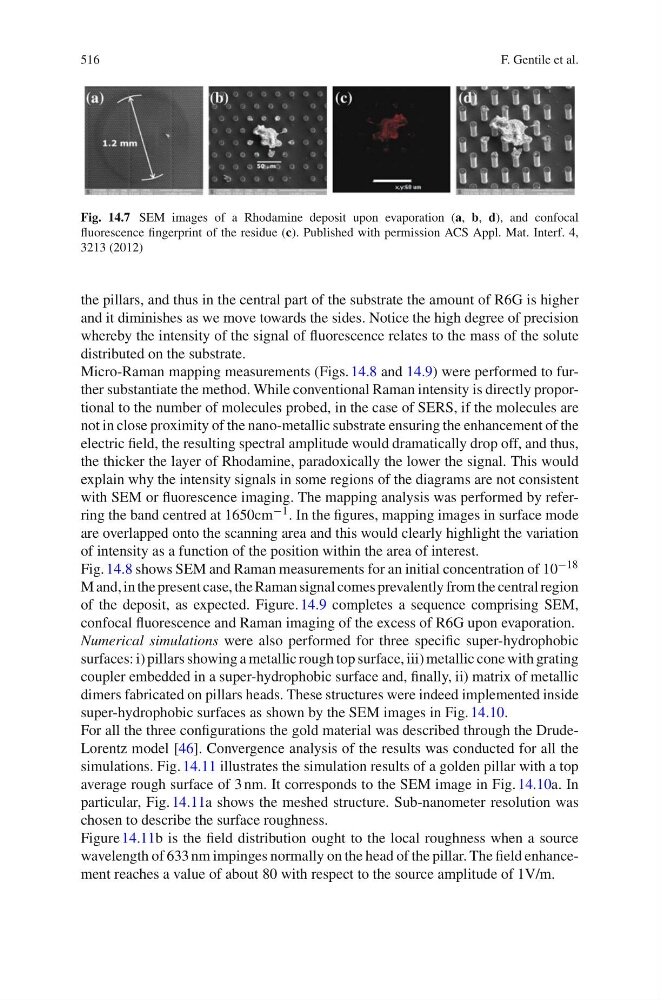
Fig. 14.7 SEM images of a Rhodamine deposit upon evaporation (a, b, d), and confocal
fluorescence fingerprint of the residue (c). Published with permission ACS Appl. Mat. Interf. 4,
3213 (2012)
the pillars, and thus in the central part of the substrate the amount of R6G is higher
and it diminishes as we move towards the sides. Notice the high degree of precision
whereby the intensity of the signal of fluorescence relates to the mass of the solute
distributed on the substrate.
Micro-Raman mapping measurements (Figs. 14.8 and 14.9) were performed to further substantiate the method. While conventional Raman intensity is directly proportional to the number of molecules probed, in the case of SERS, if the molecules are
not in close proximity of the nano-metallic substrate ensuring the enhancement of the
electric field, the resulting spectral amplitude would dramatically drop off, and thus,
the thicker the layer of Rhodamine, paradoxically the lower the signal. This would
explain why the intensity signals in some regions of the diagrams are not consistent
with SEM or fluorescence imaging. The mapping analysis was performed by referring the band centred at 1650cm −1 . In the figures, mapping images in surface mode
are overlapped onto the scanning area and this would clearly highlight the variation
of intensity as a function of the position within the area of interest.
Fig. 14.8 shows SEM and Raman measurements for an initial concentration of 10 −18
M and, in the present case, the Raman signal comes prevalently from the central region
of the deposit, as expected. Figure. 14.9 completes a sequence comprising SEM,
confocal fluorescence and Raman imaging of the excess of R6G upon evaporation.
Numerical simulations were also performed for three specific super-hydrophobic
surfaces: i) pillars showing a metallic rough top surface, iii) metallic cone with grating
coupler embedded in a super-hydrophobic surface and, finally, ii) matrix of metallic
dimers fabricated on pillars heads. These structures were indeed implemented inside
super-hydrophobic surfaces as shown by the SEM images in Fig. 14.10.
For all the three configurations the gold material was described through the DrudeLorentz model [46]. Convergence analysis of the results was conducted for all the
simulations. Fig. 14.11 illustrates the simulation results of a golden pillar with a top
average rough surface of 3 nm. It corresponds to the SEM image in Fig. 14.10a. In
particular, Fig. 14.11a shows the meshed structure. Sub-nanometer resolution was
chosen to describe the surface roughness.
Figure 14.11b is the field distribution ought to the local roughness when a source
wavelength of 633 nm impinges normally on the head of the pillar. The field enhancement reaches a value of about 80 with respect to the source amplitude of 1V/m.
F. Gentile et al.
Fig. 14.7 SEM images of a Rhodamine deposit upon evaporation (a, b, d), and confocal
fluorescence fingerprint of the residue (c). Published with permission ACS Appl. Mat. Interf. 4,
3213 (2012)
the pillars, and thus in the central part of the substrate the amount of R6G is higher
and it diminishes as we move towards the sides. Notice the high degree of precision
whereby the intensity of the signal of fluorescence relates to the mass of the solute
distributed on the substrate.
Micro-Raman mapping measurements (Figs. 14.8 and 14.9) were performed to further substantiate the method. While conventional Raman intensity is directly proportional to the number of molecules probed, in the case of SERS, if the molecules are
not in close proximity of the nano-metallic substrate ensuring the enhancement of the
electric field, the resulting spectral amplitude would dramatically drop off, and thus,
the thicker the layer of Rhodamine, paradoxically the lower the signal. This would
explain why the intensity signals in some regions of the diagrams are not consistent
with SEM or fluorescence imaging. The mapping analysis was performed by referring the band centred at 1650cm −1 . In the figures, mapping images in surface mode
are overlapped onto the scanning area and this would clearly highlight the variation
of intensity as a function of the position within the area of interest.
Fig. 14.8 shows SEM and Raman measurements for an initial concentration of 10 −18
M and, in the present case, the Raman signal comes prevalently from the central region
of the deposit, as expected. Figure. 14.9 completes a sequence comprising SEM,
confocal fluorescence and Raman imaging of the excess of R6G upon evaporation.
Numerical simulations were also performed for three specific super-hydrophobic
surfaces: i) pillars showing a metallic rough top surface, iii) metallic cone with grating
coupler embedded in a super-hydrophobic surface and, finally, ii) matrix of metallic
dimers fabricated on pillars heads. These structures were indeed implemented inside
super-hydrophobic surfaces as shown by the SEM images in Fig. 14.10.
For all the three configurations the gold material was described through the DrudeLorentz model [46]. Convergence analysis of the results was conducted for all the
simulations. Fig. 14.11 illustrates the simulation results of a golden pillar with a top
average rough surface of 3 nm. It corresponds to the SEM image in Fig. 14.10a. In
particular, Fig. 14.11a shows the meshed structure. Sub-nanometer resolution was
chosen to describe the surface roughness.
Figure 14.11b is the field distribution ought to the local roughness when a source
wavelength of 633 nm impinges normally on the head of the pillar. The field enhancement reaches a value of about 80 with respect to the source amplitude of 1V/m.