

14 Plasmonics and Super-Hydrophobicity
515
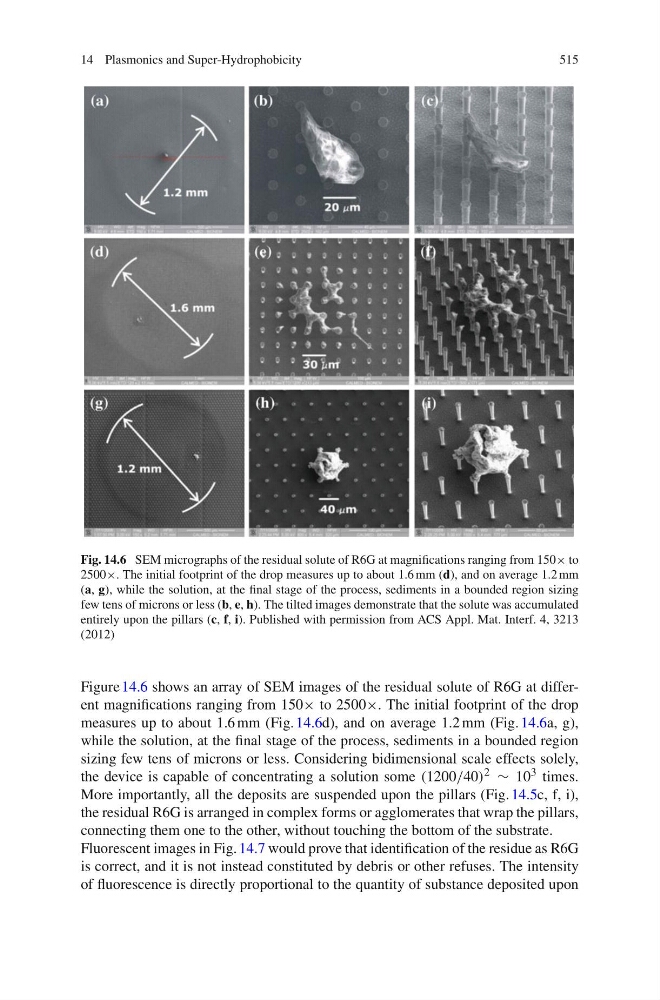
Fig. 14.6 SEM micrographs of the residual solute of R6G at magnifications ranging from 150× to
2500×. The initial footprint of the drop measures up to about 1.6 mm (d), and on average 1.2mm
(a, g), while the solution, at the final stage of the process, sediments in a bounded region sizing
few tens of microns or less (b, e, h). The tilted images demonstrate that the solute was accumulated
entirely upon the pillars (c, f, i). Published with permission from ACS Appl. Mat. Interf. 4, 3213
(2012)
Figure 14.6 shows an array of SEM images of the residual solute of R6G at different magnifications ranging from 150× to 2500×. The initial footprint of the drop
measures up to about 1.6 mm (Fig. 14.6d), and on average 1.2 mm (Fig. 14.6a, g),
while the solution, at the final stage of the process, sediments in a bounded region
sizing few tens of microns or less. Considering bidimensional scale effects solely,
the device is capable of concentrating a solution some (1200/40) 2 ≥ 10 3 times.
More importantly, all the deposits are suspended upon the pillars (Fig. 14.5c, f, i),
the residual R6G is arranged in complex forms or agglomerates that wrap the pillars,
connecting them one to the other, without touching the bottom of the substrate.
Fluorescent images in Fig. 14.7 would prove that identification of the residue as R6G
is correct, and it is not instead constituted by debris or other refuses. The intensity
of fluorescence is directly proportional to the quantity of substance deposited upon
515
Fig. 14.6 SEM micrographs of the residual solute of R6G at magnifications ranging from 150× to
2500×. The initial footprint of the drop measures up to about 1.6 mm (d), and on average 1.2mm
(a, g), while the solution, at the final stage of the process, sediments in a bounded region sizing
few tens of microns or less (b, e, h). The tilted images demonstrate that the solute was accumulated
entirely upon the pillars (c, f, i). Published with permission from ACS Appl. Mat. Interf. 4, 3213
(2012)
Figure 14.6 shows an array of SEM images of the residual solute of R6G at different magnifications ranging from 150× to 2500×. The initial footprint of the drop
measures up to about 1.6 mm (Fig. 14.6d), and on average 1.2 mm (Fig. 14.6a, g),
while the solution, at the final stage of the process, sediments in a bounded region
sizing few tens of microns or less. Considering bidimensional scale effects solely,
the device is capable of concentrating a solution some (1200/40) 2 ≥ 10 3 times.
More importantly, all the deposits are suspended upon the pillars (Fig. 14.5c, f, i),
the residual R6G is arranged in complex forms or agglomerates that wrap the pillars,
connecting them one to the other, without touching the bottom of the substrate.
Fluorescent images in Fig. 14.7 would prove that identification of the residue as R6G
is correct, and it is not instead constituted by debris or other refuses. The intensity
of fluorescence is directly proportional to the quantity of substance deposited upon