

514
F. Gentile et al.
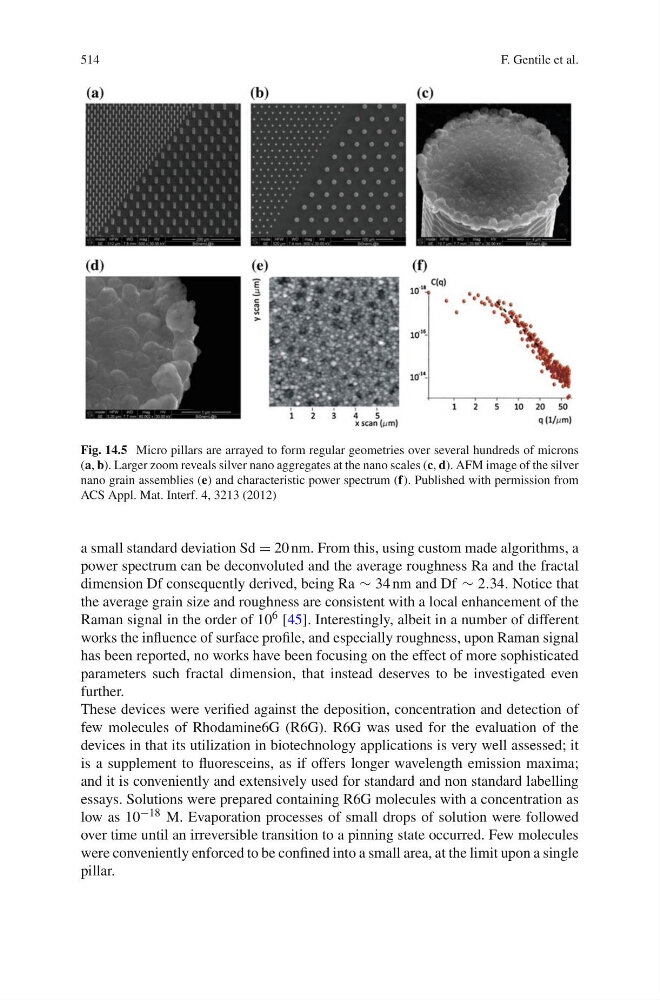
Fig. 14.5 Micro pillars are arrayed to form regular geometries over several hundreds of microns
(a, b). Larger zoom reveals silver nano aggregates at the nano scales (c, d). AFM image of the silver
nano grain assemblies (e) and characteristic power spectrum (f). Published with permission from
ACS Appl. Mat. Interf. 4, 3213 (2012)
a small standard deviation Sd = 20 nm. From this, using custom made algorithms, a
power spectrum can be deconvoluted and the average roughness Ra and the fractal
dimension Df consequently derived, being Ra ≥ 34 nm and Df ≥ 2.34. Notice that
the average grain size and roughness are consistent with a local enhancement of the
Raman signal in the order of 10 6 [45]. Interestingly, albeit in a number of different
works the influence of surface profile, and especially roughness, upon Raman signal
has been reported, no works have been focusing on the effect of more sophisticated
parameters such fractal dimension, that instead deserves to be investigated even
further.
These devices were verified against the deposition, concentration and detection of
few molecules of Rhodamine6G (R6G). R6G was used for the evaluation of the
devices in that its utilization in biotechnology applications is very well assessed; it
is a supplement to fluoresceins, as if offers longer wavelength emission maxima;
and it is conveniently and extensively used for standard and non standard labelling
essays. Solutions were prepared containing R6G molecules with a concentration as
low as 10 −18 M. Evaporation processes of small drops of solution were followed
over time until an irreversible transition to a pinning state occurred. Few molecules
were conveniently enforced to be confined into a small area, at the limit upon a single
pillar.
F. Gentile et al.
Fig. 14.5 Micro pillars are arrayed to form regular geometries over several hundreds of microns
(a, b). Larger zoom reveals silver nano aggregates at the nano scales (c, d). AFM image of the silver
nano grain assemblies (e) and characteristic power spectrum (f). Published with permission from
ACS Appl. Mat. Interf. 4, 3213 (2012)
a small standard deviation Sd = 20 nm. From this, using custom made algorithms, a
power spectrum can be deconvoluted and the average roughness Ra and the fractal
dimension Df consequently derived, being Ra ≥ 34 nm and Df ≥ 2.34. Notice that
the average grain size and roughness are consistent with a local enhancement of the
Raman signal in the order of 10 6 [45]. Interestingly, albeit in a number of different
works the influence of surface profile, and especially roughness, upon Raman signal
has been reported, no works have been focusing on the effect of more sophisticated
parameters such fractal dimension, that instead deserves to be investigated even
further.
These devices were verified against the deposition, concentration and detection of
few molecules of Rhodamine6G (R6G). R6G was used for the evaluation of the
devices in that its utilization in biotechnology applications is very well assessed; it
is a supplement to fluoresceins, as if offers longer wavelength emission maxima;
and it is conveniently and extensively used for standard and non standard labelling
essays. Solutions were prepared containing R6G molecules with a concentration as
low as 10 −18 M. Evaporation processes of small drops of solution were followed
over time until an irreversible transition to a pinning state occurred. Few molecules
were conveniently enforced to be confined into a small area, at the limit upon a single
pillar.