

13 Spinoptics in Plasmonics
493
800 850 900 950
C
ext (a.u.)
ω /2πc (cm
-1 )
m
µ
-2
0
2
-2
0
2
m
µ
2 µm
800
850
900
950
(ΙΙΙ)
(ΙΙ)
Intensity (a.u.)
ω /2πc (cm
-1
)
(Ι)
(c)
(b)
(a)
Λ
10 µm
ϕ
x
y
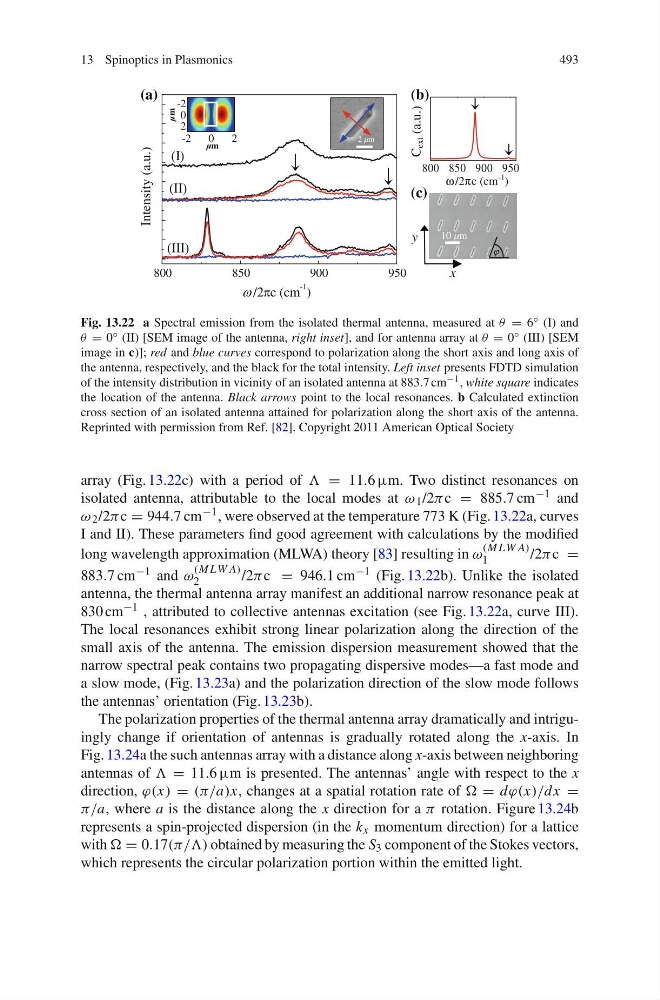
Fig. 13.22 a Spectral emission from the isolated thermal antenna, measured at τ = 6 ∈ (I) and
τ = 0 ∈ (II) [SEM image of the antenna, right inset], and for antenna array at τ = 0 ∈ (III) [SEM
image in c)]; red and blue curves correspond to polarization along the short axis and long axis of
the antenna, respectively, and the black for the total intensity. Left inset presents FDTD simulation
of the intensity distribution in vicinity of an isolated antenna at 883.7 cm −1 , white square indicates
the location of the antenna. Black arrows point to the local resonances. b Calculated extinction
cross section of an isolated antenna attained for polarization along the short axis of the antenna.
Reprinted with permission from Ref. [82]. Copyright 2011 American Optical Society
array (Fig. 13.22c) with a period of Φ = 11.6 µm. Two distinct resonances on
isolated antenna, attributable to the local modes at Θ 1 /2α c = 885.7 cm −1 and
Θ 2 /2α c = 944.7 cm −1 , were observed at the temperature 773 K (Fig. 13.22a, curves
I and II). These parameters find good agreement with calculations by the modified
long wavelength approximation (MLWA) theory [83] resulting in Θ
(M LW A)
1
/2α c =
883.7 cm −1 and Θ
(M LW A)
2
/2α c = 946.1 cm −1 (Fig. 13.22b). Unlike the isolated
antenna, the thermal antenna array manifest an additional narrow resonance peak at
830 cm −1 , attributed to collective antennas excitation (see Fig. 13.22a, curve III).
The local resonances exhibit strong linear polarization along the direction of the
small axis of the antenna. The emission dispersion measurement showed that the
narrow spectral peak contains two propagating dispersive modes—a fast mode and
a slow mode, (Fig. 13.23a) and the polarization direction of the slow mode follows
the antennas’ orientation (Fig. 13.23b).
The polarization properties of the thermal antenna array dramatically and intriguingly change if orientation of antennas is gradually rotated along the x-axis. In
Fig. 13.24a the such antennas array with a distance along x-axis between neighboring
antennas of Φ = 11.6 µm is presented. The antennas’ angle with respect to the x
direction, π(x) = (α/a)x, changes at a spatial rotation rate of ∂ = dπ(x)/dx =
α/a, where a is the distance along the x direction for a α rotation. Figure 13.24b
represents a spin-projected dispersion (in the k x momentum direction) for a lattice
with ∂ = 0.17(α/Φ) obtained by measuring the S 3 component of the Stokes vectors,
which represents the circular polarization portion within the emitted light.
493
800 850 900 950
C
ext (a.u.)
ω /2πc (cm
-1 )
m
µ
-2
0
2
-2
0
2
m
µ
2 µm
800
850
900
950
(ΙΙΙ)
(ΙΙ)
Intensity (a.u.)
ω /2πc (cm
-1
)
(Ι)
(c)
(b)
(a)
Λ
10 µm
ϕ
x
y
Fig. 13.22 a Spectral emission from the isolated thermal antenna, measured at τ = 6 ∈ (I) and
τ = 0 ∈ (II) [SEM image of the antenna, right inset], and for antenna array at τ = 0 ∈ (III) [SEM
image in c)]; red and blue curves correspond to polarization along the short axis and long axis of
the antenna, respectively, and the black for the total intensity. Left inset presents FDTD simulation
of the intensity distribution in vicinity of an isolated antenna at 883.7 cm −1 , white square indicates
the location of the antenna. Black arrows point to the local resonances. b Calculated extinction
cross section of an isolated antenna attained for polarization along the short axis of the antenna.
Reprinted with permission from Ref. [82]. Copyright 2011 American Optical Society
array (Fig. 13.22c) with a period of Φ = 11.6 µm. Two distinct resonances on
isolated antenna, attributable to the local modes at Θ 1 /2α c = 885.7 cm −1 and
Θ 2 /2α c = 944.7 cm −1 , were observed at the temperature 773 K (Fig. 13.22a, curves
I and II). These parameters find good agreement with calculations by the modified
long wavelength approximation (MLWA) theory [83] resulting in Θ
(M LW A)
1
/2α c =
883.7 cm −1 and Θ
(M LW A)
2
/2α c = 946.1 cm −1 (Fig. 13.22b). Unlike the isolated
antenna, the thermal antenna array manifest an additional narrow resonance peak at
830 cm −1 , attributed to collective antennas excitation (see Fig. 13.22a, curve III).
The local resonances exhibit strong linear polarization along the direction of the
small axis of the antenna. The emission dispersion measurement showed that the
narrow spectral peak contains two propagating dispersive modes—a fast mode and
a slow mode, (Fig. 13.23a) and the polarization direction of the slow mode follows
the antennas’ orientation (Fig. 13.23b).
The polarization properties of the thermal antenna array dramatically and intriguingly change if orientation of antennas is gradually rotated along the x-axis. In
Fig. 13.24a the such antennas array with a distance along x-axis between neighboring
antennas of Φ = 11.6 µm is presented. The antennas’ angle with respect to the x
direction, π(x) = (α/a)x, changes at a spatial rotation rate of ∂ = dπ(x)/dx =
α/a, where a is the distance along the x direction for a α rotation. Figure 13.24b
represents a spin-projected dispersion (in the k x momentum direction) for a lattice
with ∂ = 0.17(α/Φ) obtained by measuring the S 3 component of the Stokes vectors,
which represents the circular polarization portion within the emitted light.