

442
S. V. Boriskina
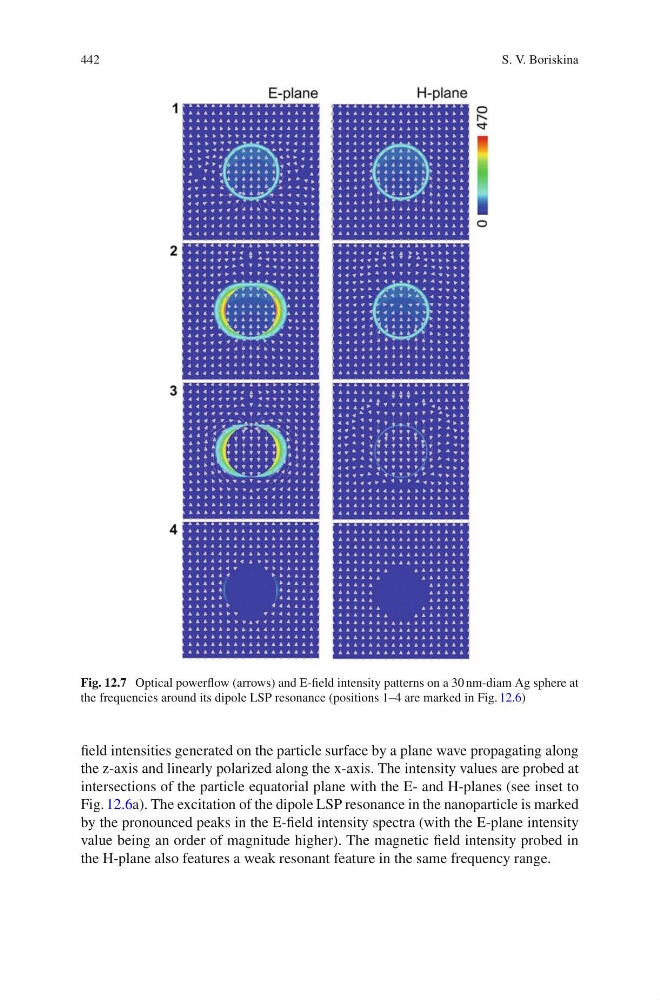
Fig. 12.7 Optical powerflow (arrows) and E-field intensity patterns on a 30 nm-diam Ag sphere at
the frequencies around its dipole LSP resonance (positions 1–4 are marked in Fig. 12.6)
field intensities generated on the particle surface by a plane wave propagating along
the z-axis and linearly polarized along the x-axis. The intensity values are probed at
intersections of the particle equatorial plane with the E- and H-planes (see inset to
Fig. 12.6a). The excitation of the dipole LSP resonance in the nanoparticle is marked
by the pronounced peaks in the E-field intensity spectra (with the E-plane intensity
value being an order of magnitude higher). The magnetic field intensity probed in
the H-plane also features a weak resonant feature in the same frequency range.
S. V. Boriskina
Fig. 12.7 Optical powerflow (arrows) and E-field intensity patterns on a 30 nm-diam Ag sphere at
the frequencies around its dipole LSP resonance (positions 1–4 are marked in Fig. 12.6)
field intensities generated on the particle surface by a plane wave propagating along
the z-axis and linearly polarized along the x-axis. The intensity values are probed at
intersections of the particle equatorial plane with the E- and H-planes (see inset to
Fig. 12.6a). The excitation of the dipole LSP resonance in the nanoparticle is marked
by the pronounced peaks in the E-field intensity spectra (with the E-plane intensity
value being an order of magnitude higher). The magnetic field intensity probed in
the H-plane also features a weak resonant feature in the same frequency range.