

12 Plasmonics with a Twist: Taming Optical Tornadoes on the Nanoscale
443
To reveal the direction and density of the optical power flux around the nanoparticle on and off its LSP resonance, the frequency spectra of the z-component of
the Poynting vector (pointing in the direction of the plane wave propagation) are
plotted in Fig. 12.6b. The Poynting vector (12.2) is a 3D real-valued vector field,
which in the Cartesian coordinate system is defined by three orthogonal components:
S =
S x , S y , S z
. The plots in Fig. 12.6b show that the direction of the powerflow
around the particle changes abruptly from forward (characterized by positive S z values) to backward (negative S z ) at the wavelength of the LSP resonance. The phase
change by ∂ at a resonance is a manifestation of the delay between the action of the
driving force and the oscillator response. It is a characteristic feature of any resonant
structure driven by the external field, including classical forced oscillators [77, 78].
However, the spatial distributions of the Poynting vector field around the particle on
and off resonance shown in Fig. 12.7 reveal an intricate picture of local powerflow.
In particular, a pair of saddle nodes can be observed in the on-resonance powerflow
pattern 2, while at the frequencies just around the LSP resonance, the powerflow
forms pairs of coupled counter-rotating vortices (patterns 1 and 3 in Fig. 12.7). Only
far away from the resonant frequency (pattern 4) the flow resembles the one discussed
by Bohren (compare to Fig. 12.4b). Hereafter, the arrows point into the direction of
the local powerflow, and the length of each arrow is proportional to the local value
of the Poynting vector amplitude.
First predicted theoretically several years ago [68, 81], the effect of formation of
optical whirlpools in individual nanoparticles initially did not attract a lot of attention
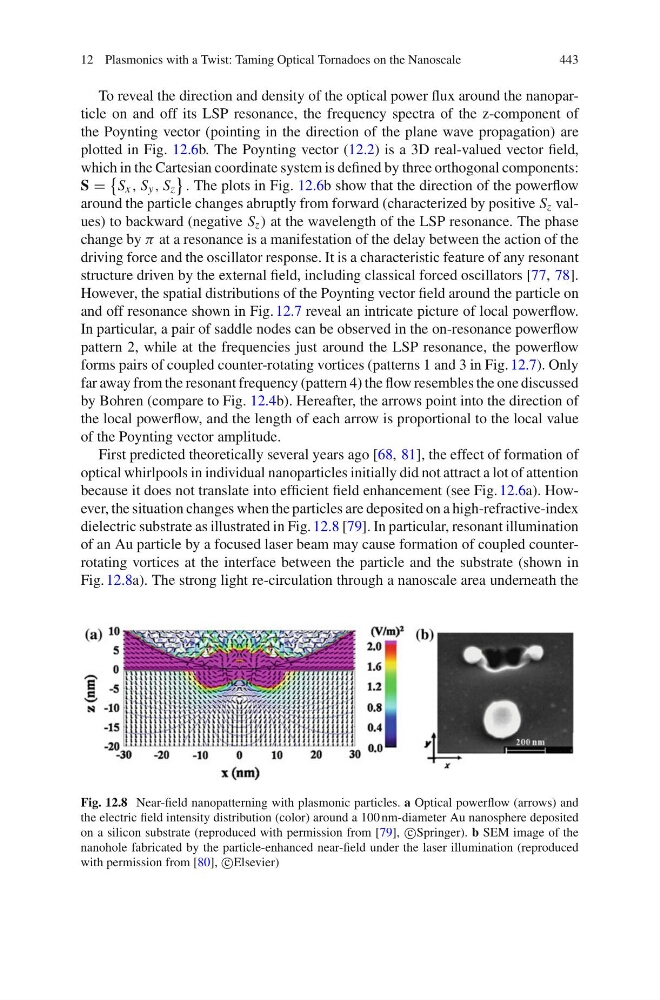
because it does not translate into efficient field enhancement (see Fig. 12.6a). However, the situation changes when the particles are deposited on a high-refractive-index
dielectric substrate as illustrated in Fig. 12.8 [79]. In particular, resonant illumination
of an Au particle by a focused laser beam may cause formation of coupled counterrotating vortices at the interface between the particle and the substrate (shown in
Fig. 12.8a). The strong light re-circulation through a nanoscale area underneath the
Fig. 12.8 Near-field nanopatterning with plasmonic particles. a Optical powerflow (arrows) and
the electric field intensity distribution (color) around a 100 nm-diameter Au nanosphere deposited
on a silicon substrate (reproduced with permission from [79], c
∪Springer). b SEM image of the
nanohole fabricated by the particle-enhanced near-field under the laser illumination (reproduced
with permission from [80], c
∪Elsevier)
443
To reveal the direction and density of the optical power flux around the nanoparticle on and off its LSP resonance, the frequency spectra of the z-component of
the Poynting vector (pointing in the direction of the plane wave propagation) are
plotted in Fig. 12.6b. The Poynting vector (12.2) is a 3D real-valued vector field,
which in the Cartesian coordinate system is defined by three orthogonal components:
S =
S x , S y , S z
. The plots in Fig. 12.6b show that the direction of the powerflow
around the particle changes abruptly from forward (characterized by positive S z values) to backward (negative S z ) at the wavelength of the LSP resonance. The phase
change by ∂ at a resonance is a manifestation of the delay between the action of the
driving force and the oscillator response. It is a characteristic feature of any resonant
structure driven by the external field, including classical forced oscillators [77, 78].
However, the spatial distributions of the Poynting vector field around the particle on
and off resonance shown in Fig. 12.7 reveal an intricate picture of local powerflow.
In particular, a pair of saddle nodes can be observed in the on-resonance powerflow
pattern 2, while at the frequencies just around the LSP resonance, the powerflow
forms pairs of coupled counter-rotating vortices (patterns 1 and 3 in Fig. 12.7). Only
far away from the resonant frequency (pattern 4) the flow resembles the one discussed
by Bohren (compare to Fig. 12.4b). Hereafter, the arrows point into the direction of
the local powerflow, and the length of each arrow is proportional to the local value
of the Poynting vector amplitude.
First predicted theoretically several years ago [68, 81], the effect of formation of
optical whirlpools in individual nanoparticles initially did not attract a lot of attention
because it does not translate into efficient field enhancement (see Fig. 12.6a). However, the situation changes when the particles are deposited on a high-refractive-index
dielectric substrate as illustrated in Fig. 12.8 [79]. In particular, resonant illumination
of an Au particle by a focused laser beam may cause formation of coupled counterrotating vortices at the interface between the particle and the substrate (shown in
Fig. 12.8a). The strong light re-circulation through a nanoscale area underneath the
Fig. 12.8 Near-field nanopatterning with plasmonic particles. a Optical powerflow (arrows) and
the electric field intensity distribution (color) around a 100 nm-diameter Au nanosphere deposited
on a silicon substrate (reproduced with permission from [79], c
∪Springer). b SEM image of the
nanohole fabricated by the particle-enhanced near-field under the laser illumination (reproduced
with permission from [80], c
∪Elsevier)