

12 Plasmonics with a Twist: Taming Optical Tornadoes on the Nanoscale
441
scattered by sub-wavelength slits can also be detrimental as it results in the phenomenon of the frustrated transmission [66]. Likewise, the motion of ‘Abrikosov vortices’
–nanoscale tubes of magnetic flux that form inside superconductors upon exposure
to magnetic fields–decreases the current-carrying capability of superconductors and
requires vortex immobilization ( or ‘pinning’) by the material artificial defects [75,
76]. To pin vortices effectively, in-depth understanding of the pinning strength of
individual defects as well as the collective effects of many defects interacting with
many vortices is required.
In a perfect analogy, developing a general design strategy of pinning optical vortices to properly-designed plasmonic nanostructures would offer an unprecedented
degree of control over light trapping in sub-wavelength volumes and in dynamical manipulation of nanoscale powerflow patterns. We already saw in the previous
sections that resonant scattering of light from noble-metal nanoparticles creates a
complex spatial distribution of the time-averaged Poynting vector in their near-field.
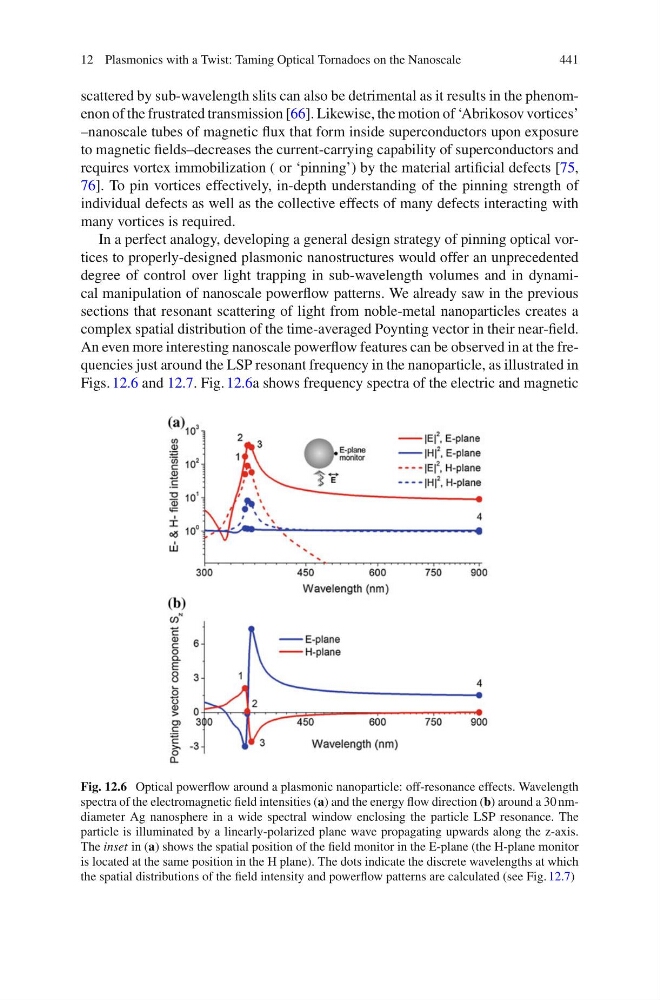
An even more interesting nanoscale powerflow features can be observed in at the frequencies just around the LSP resonant frequency in the nanoparticle, as illustrated in
Figs. 12.6 and 12.7. Fig. 12.6a shows frequency spectra of the electric and magnetic
Fig. 12.6 Optical powerflow around a plasmonic nanoparticle: off-resonance effects. Wavelength
spectra of the electromagnetic field intensities (a) and the energy flow direction (b) around a 30 nmdiameter Ag nanosphere in a wide spectral window enclosing the particle LSP resonance. The
particle is illuminated by a linearly-polarized plane wave propagating upwards along the z-axis.
The inset in (a) shows the spatial position of the field monitor in the E-plane (the H-plane monitor
is located at the same position in the H plane). The dots indicate the discrete wavelengths at which
the spatial distributions of the field intensity and powerflow patterns are calculated (see Fig. 12.7)
441
scattered by sub-wavelength slits can also be detrimental as it results in the phenomenon of the frustrated transmission [66]. Likewise, the motion of ‘Abrikosov vortices’
–nanoscale tubes of magnetic flux that form inside superconductors upon exposure
to magnetic fields–decreases the current-carrying capability of superconductors and
requires vortex immobilization ( or ‘pinning’) by the material artificial defects [75,
76]. To pin vortices effectively, in-depth understanding of the pinning strength of
individual defects as well as the collective effects of many defects interacting with
many vortices is required.
In a perfect analogy, developing a general design strategy of pinning optical vortices to properly-designed plasmonic nanostructures would offer an unprecedented
degree of control over light trapping in sub-wavelength volumes and in dynamical manipulation of nanoscale powerflow patterns. We already saw in the previous
sections that resonant scattering of light from noble-metal nanoparticles creates a
complex spatial distribution of the time-averaged Poynting vector in their near-field.
An even more interesting nanoscale powerflow features can be observed in at the frequencies just around the LSP resonant frequency in the nanoparticle, as illustrated in
Figs. 12.6 and 12.7. Fig. 12.6a shows frequency spectra of the electric and magnetic
Fig. 12.6 Optical powerflow around a plasmonic nanoparticle: off-resonance effects. Wavelength
spectra of the electromagnetic field intensities (a) and the energy flow direction (b) around a 30 nmdiameter Ag nanosphere in a wide spectral window enclosing the particle LSP resonance. The
particle is illuminated by a linearly-polarized plane wave propagating upwards along the z-axis.
The inset in (a) shows the spatial position of the field monitor in the E-plane (the H-plane monitor
is located at the same position in the H plane). The dots indicate the discrete wavelengths at which
the spatial distributions of the field intensity and powerflow patterns are calculated (see Fig. 12.7)