

8 Controlling Thermal Radiation with Surface Waves
317
(a)
(b)
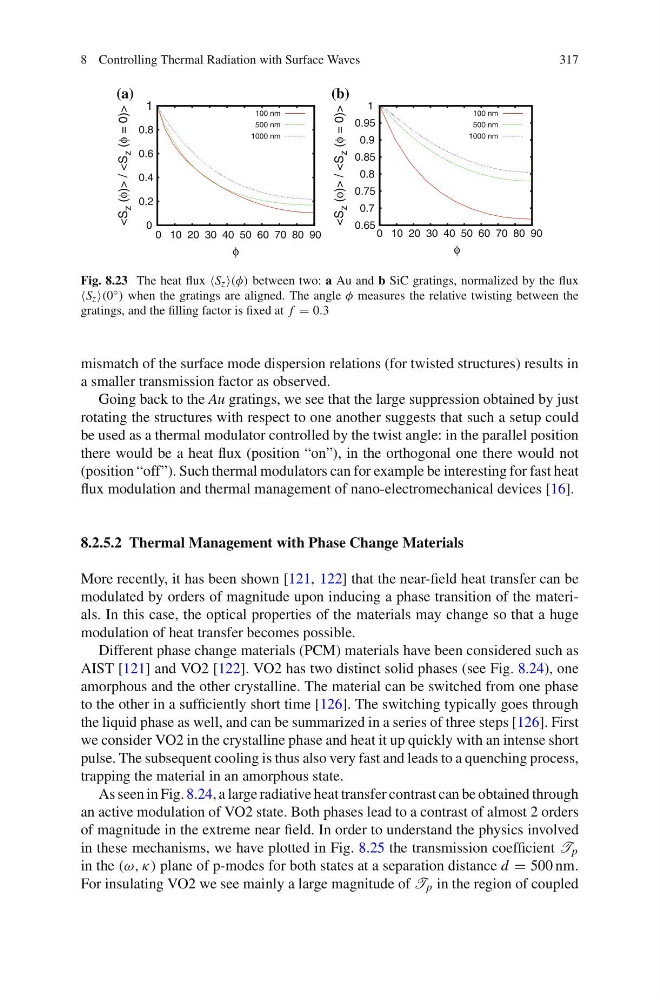
Fig. 8.23 The heat flux ∪S z ∼(φ) between two: a Au and b SiC gratings, normalized by the flux
∪S z ∼(0 ◦ ) when the gratings are aligned. The angle φ measures the relative twisting between the
gratings, and the filling factor is fixed at f = 0.3
mismatch of the surface mode dispersion relations (for twisted structures) results in
a smaller transmission factor as observed.
Going back to the Au gratings, we see that the large suppression obtained by just
rotating the structures with respect to one another suggests that such a setup could
be used as a thermal modulator controlled by the twist angle: in the parallel position
there would be a heat flux (position “on”), in the orthogonal one there would not
(position “off”). Such thermal modulators can for example be interesting for fast heat
flux modulation and thermal management of nano-electromechanical devices [16].
8.2.5.2 Thermal Management with Phase Change Materials
More recently, it has been shown [121, 122] that the near-field heat transfer can be
modulated by orders of magnitude upon inducing a phase transition of the materials. In this case, the optical properties of the materials may change so that a huge
modulation of heat transfer becomes possible.
Different phase change materials (PCM) materials have been considered such as
AIST [121] and VO2 [122]. VO2 has two distinct solid phases (see Fig. 8.24), one
amorphous and the other crystalline. The material can be switched from one phase
to the other in a sufficiently short time [126]. The switching typically goes through
the liquid phase as well, and can be summarized in a series of three steps [126]. First
we consider VO2 in the crystalline phase and heat it up quickly with an intense short
pulse. The subsequent cooling is thus also very fast and leads to a quenching process,
trapping the material in an amorphous state.
As seen in Fig. 8.24, a large radiative heat transfer contrast can be obtained through
an active modulation of VO2 state. Both phases lead to a contrast of almost 2 orders
of magnitude in the extreme near field. In order to understand the physics involved
in these mechanisms, we have plotted in Fig. 8.25 the transmission coefficient T p
in the (ω, κ) plane of p-modes for both states at a separation distance d = 500 nm.
For insulating VO2 we see mainly a large magnitude of T p in the region of coupled
317
(a)
(b)
Fig. 8.23 The heat flux ∪S z ∼(φ) between two: a Au and b SiC gratings, normalized by the flux
∪S z ∼(0 ◦ ) when the gratings are aligned. The angle φ measures the relative twisting between the
gratings, and the filling factor is fixed at f = 0.3
mismatch of the surface mode dispersion relations (for twisted structures) results in
a smaller transmission factor as observed.
Going back to the Au gratings, we see that the large suppression obtained by just
rotating the structures with respect to one another suggests that such a setup could
be used as a thermal modulator controlled by the twist angle: in the parallel position
there would be a heat flux (position “on”), in the orthogonal one there would not
(position “off”). Such thermal modulators can for example be interesting for fast heat
flux modulation and thermal management of nano-electromechanical devices [16].
8.2.5.2 Thermal Management with Phase Change Materials
More recently, it has been shown [121, 122] that the near-field heat transfer can be
modulated by orders of magnitude upon inducing a phase transition of the materials. In this case, the optical properties of the materials may change so that a huge
modulation of heat transfer becomes possible.
Different phase change materials (PCM) materials have been considered such as
AIST [121] and VO2 [122]. VO2 has two distinct solid phases (see Fig. 8.24), one
amorphous and the other crystalline. The material can be switched from one phase
to the other in a sufficiently short time [126]. The switching typically goes through
the liquid phase as well, and can be summarized in a series of three steps [126]. First
we consider VO2 in the crystalline phase and heat it up quickly with an intense short
pulse. The subsequent cooling is thus also very fast and leads to a quenching process,
trapping the material in an amorphous state.
As seen in Fig. 8.24, a large radiative heat transfer contrast can be obtained through
an active modulation of VO2 state. Both phases lead to a contrast of almost 2 orders
of magnitude in the extreme near field. In order to understand the physics involved
in these mechanisms, we have plotted in Fig. 8.25 the transmission coefficient T p
in the (ω, κ) plane of p-modes for both states at a separation distance d = 500 nm.
For insulating VO2 we see mainly a large magnitude of T p in the region of coupled