

8 Controlling Thermal Radiation with Surface Waves
311
(a)
(b)
(c)
(d)
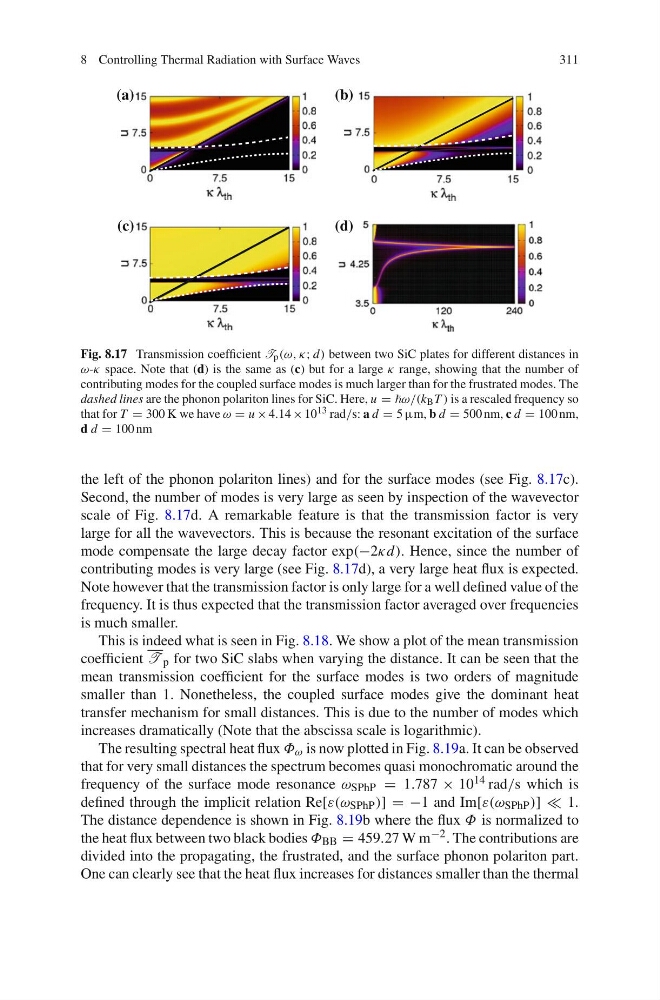
Fig. 8.17 Transmission coefficient T p (ω, κ; d) between two SiC plates for different distances in
ω-κ space. Note that (d) is the same as (c) but for a large κ range, showing that the number of
contributing modes for the coupled surface modes is much larger than for the frustrated modes. The
dashed lines are the phonon polariton lines for SiC. Here, u = ω/(k B T ) is a rescaled frequency so
that for T = 300 K we have ω = u × 4.14 × 10 13 rad/s: a d = 5 µm, b d = 500 nm, c d = 100 nm,
d d = 100 nm
the left of the phonon polariton lines) and for the surface modes (see Fig. 8.17c).
Second, the number of modes is very large as seen by inspection of the wavevector
scale of Fig. 8.17d. A remarkable feature is that the transmission factor is very
large for all the wavevectors. This is because the resonant excitation of the surface
mode compensate the large decay factor exp(−2κd). Hence, since the number of
contributing modes is very large (see Fig. 8.17d), a very large heat flux is expected.
Note however that the transmission factor is only large for a well defined value of the
frequency. It is thus expected that the transmission factor averaged over frequencies
is much smaller.
This is indeed what is seen in Fig. 8.18. We show a plot of the mean transmission
coefficient T p for two SiC slabs when varying the distance. It can be seen that the
mean transmission coefficient for the surface modes is two orders of magnitude
smaller than 1. Nonetheless, the coupled surface modes give the dominant heat
transfer mechanism for small distances. This is due to the number of modes which
increases dramatically (Note that the abscissa scale is logarithmic).
The resulting spectral heat flux Φ ω is now plotted in Fig. 8.19a. It can be observed
that for very small distances the spectrum becomes quasi monochromatic around the
frequency of the surface mode resonance ω SPhP = 1.787 × 10 14 rad/s which is
defined through the implicit relation Re[ε(ω SPhP )] = −1 and Im[ε(ω SPhP )] ∞ 1.
The distance dependence is shown in Fig. 8.19b where the flux Φ is normalized to
the heat flux between two black bodies Φ BB = 459.27 W m −2 . The contributions are
divided into the propagating, the frustrated, and the surface phonon polariton part.
One can clearly see that the heat flux increases for distances smaller than the thermal
311
(a)
(b)
(c)
(d)
Fig. 8.17 Transmission coefficient T p (ω, κ; d) between two SiC plates for different distances in
ω-κ space. Note that (d) is the same as (c) but for a large κ range, showing that the number of
contributing modes for the coupled surface modes is much larger than for the frustrated modes. The
dashed lines are the phonon polariton lines for SiC. Here, u = ω/(k B T ) is a rescaled frequency so
that for T = 300 K we have ω = u × 4.14 × 10 13 rad/s: a d = 5 µm, b d = 500 nm, c d = 100 nm,
d d = 100 nm
the left of the phonon polariton lines) and for the surface modes (see Fig. 8.17c).
Second, the number of modes is very large as seen by inspection of the wavevector
scale of Fig. 8.17d. A remarkable feature is that the transmission factor is very
large for all the wavevectors. This is because the resonant excitation of the surface
mode compensate the large decay factor exp(−2κd). Hence, since the number of
contributing modes is very large (see Fig. 8.17d), a very large heat flux is expected.
Note however that the transmission factor is only large for a well defined value of the
frequency. It is thus expected that the transmission factor averaged over frequencies
is much smaller.
This is indeed what is seen in Fig. 8.18. We show a plot of the mean transmission
coefficient T p for two SiC slabs when varying the distance. It can be seen that the
mean transmission coefficient for the surface modes is two orders of magnitude
smaller than 1. Nonetheless, the coupled surface modes give the dominant heat
transfer mechanism for small distances. This is due to the number of modes which
increases dramatically (Note that the abscissa scale is logarithmic).
The resulting spectral heat flux Φ ω is now plotted in Fig. 8.19a. It can be observed
that for very small distances the spectrum becomes quasi monochromatic around the
frequency of the surface mode resonance ω SPhP = 1.787 × 10 14 rad/s which is
defined through the implicit relation Re[ε(ω SPhP )] = −1 and Im[ε(ω SPhP )] ∞ 1.
The distance dependence is shown in Fig. 8.19b where the flux Φ is normalized to
the heat flux between two black bodies Φ BB = 459.27 W m −2 . The contributions are
divided into the propagating, the frustrated, and the surface phonon polariton part.
One can clearly see that the heat flux increases for distances smaller than the thermal