

310
P. Ben-Abdallah et al.
(a)
k x
c
/
ω
ε
c
/
ω
d
/
1
~
k y
(b)
= c
L
T
κ
κ
ω
ω
ω
ω
(c)
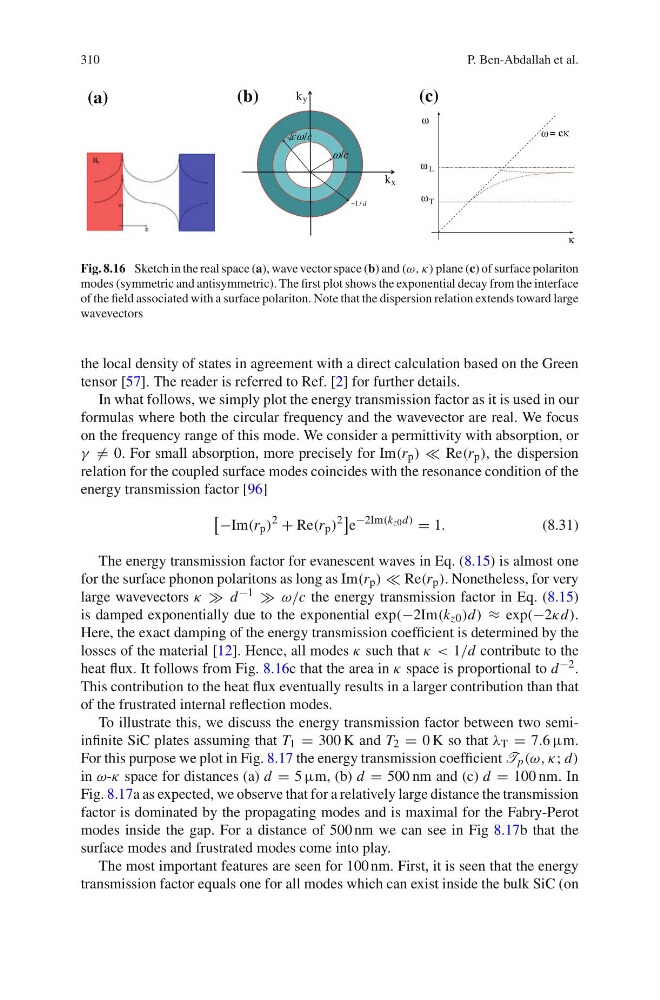
Fig. 8.16 Sketch in the real space (a), wave vector space (b) and (ω, κ) plane (c) of surface polariton
modes (symmetric and antisymmetric). The first plot shows the exponential decay from the interface
of the field associated with a surface polariton. Note that the dispersion relation extends toward large
wavevectors
the local density of states in agreement with a direct calculation based on the Green
tensor [57]. The reader is referred to Ref. [2] for further details.
In what follows, we simply plot the energy transmission factor as it is used in our
formulas where both the circular frequency and the wavevector are real. We focus
on the frequency range of this mode. We consider a permittivity with absorption, or
γ → = 0. For small absorption, more precisely for Im(r p ) ∞ Re(r p ), the dispersion
relation for the coupled surface modes coincides with the resonance condition of the
energy transmission factor [96]
−Im(r p )
2
+ Re(r p )
2
e
−2Im(k z0 d)
= 1.
(8.31)
The energy transmission factor for evanescent waves in Eq. (8.15) is almost one
for the surface phonon polaritons as long as Im(r p ) ∞ Re(r p ). Nonetheless, for very
large wavevectors κ ≡ d −1 ≡ ω/c the energy transmission factor in Eq. (8.15)
is damped exponentially due to the exponential exp(−2Im(k z0 )d) ∗ exp(−2κd).
Here, the exact damping of the energy transmission coefficient is determined by the
losses of the material [12]. Hence, all modes κ such that κ < 1/d contribute to the
heat flux. It follows from Fig. 8.16c that the area in κ space is proportional to d −2 .
This contribution to the heat flux eventually results in a larger contribution than that
of the frustrated internal reflection modes.
To illustrate this, we discuss the energy transmission factor between two semiinfinite SiC plates assuming that T 1 = 300 K and T 2 = 0 K so that λ T = 7.6 µm.
For this purpose we plot in Fig. 8.17 the energy transmission coefficient T p (ω, κ; d)
in ω-κ space for distances (a) d = 5 µm, (b) d = 500 nm and (c) d = 100 nm. In
Fig. 8.17a as expected, we observe that for a relatively large distance the transmission
factor is dominated by the propagating modes and is maximal for the Fabry-Perot
modes inside the gap. For a distance of 500 nm we can see in Fig 8.17b that the
surface modes and frustrated modes come into play.
The most important features are seen for 100 nm. First, it is seen that the energy
transmission factor equals one for all modes which can exist inside the bulk SiC (on
P. Ben-Abdallah et al.
(a)
k x
c
/
ω
ε
c
/
ω
d
/
1
~
k y
(b)
= c
L
T
κ
κ
ω
ω
ω
ω
(c)
Fig. 8.16 Sketch in the real space (a), wave vector space (b) and (ω, κ) plane (c) of surface polariton
modes (symmetric and antisymmetric). The first plot shows the exponential decay from the interface
of the field associated with a surface polariton. Note that the dispersion relation extends toward large
wavevectors
the local density of states in agreement with a direct calculation based on the Green
tensor [57]. The reader is referred to Ref. [2] for further details.
In what follows, we simply plot the energy transmission factor as it is used in our
formulas where both the circular frequency and the wavevector are real. We focus
on the frequency range of this mode. We consider a permittivity with absorption, or
γ → = 0. For small absorption, more precisely for Im(r p ) ∞ Re(r p ), the dispersion
relation for the coupled surface modes coincides with the resonance condition of the
energy transmission factor [96]
−Im(r p )
2
+ Re(r p )
2
e
−2Im(k z0 d)
= 1.
(8.31)
The energy transmission factor for evanescent waves in Eq. (8.15) is almost one
for the surface phonon polaritons as long as Im(r p ) ∞ Re(r p ). Nonetheless, for very
large wavevectors κ ≡ d −1 ≡ ω/c the energy transmission factor in Eq. (8.15)
is damped exponentially due to the exponential exp(−2Im(k z0 )d) ∗ exp(−2κd).
Here, the exact damping of the energy transmission coefficient is determined by the
losses of the material [12]. Hence, all modes κ such that κ < 1/d contribute to the
heat flux. It follows from Fig. 8.16c that the area in κ space is proportional to d −2 .
This contribution to the heat flux eventually results in a larger contribution than that
of the frustrated internal reflection modes.
To illustrate this, we discuss the energy transmission factor between two semiinfinite SiC plates assuming that T 1 = 300 K and T 2 = 0 K so that λ T = 7.6 µm.
For this purpose we plot in Fig. 8.17 the energy transmission coefficient T p (ω, κ; d)
in ω-κ space for distances (a) d = 5 µm, (b) d = 500 nm and (c) d = 100 nm. In
Fig. 8.17a as expected, we observe that for a relatively large distance the transmission
factor is dominated by the propagating modes and is maximal for the Fabry-Perot
modes inside the gap. For a distance of 500 nm we can see in Fig 8.17b that the
surface modes and frustrated modes come into play.
The most important features are seen for 100 nm. First, it is seen that the energy
transmission factor equals one for all modes which can exist inside the bulk SiC (on