

292
P. Ben-Abdallah et al.
We take here the example of a silicon carbide sample. Silicon carbide is a polar
material, which can support surface phonons in the range 10.5–12.5 µm. It can be
described by the permittivity
ε 1 (ω) = ε 2 (ω) = ε ∞
ω 2
L − ω 2 − iγ ω
ω 2
T − ω 2 − iγ ω
∈ ε(ω),
(8.5)
with the longitudinal phonon frequency ω L = 1.827 × 10 14 rad/s, the transversal
phonon frequency ω T = 1.495 × 10 14 rad/s, the damping γ = 0.9 × 10 12 rad/s and
ε ∞ = 6.7.
A period a = 6.25 µm is chosen to permit the whole dispersion relation to be
coupled to propagating waves. The filling factor of 50 % and the height h = 285 nm
have been optimized to have the better efficiency in the coupling at a wavelength
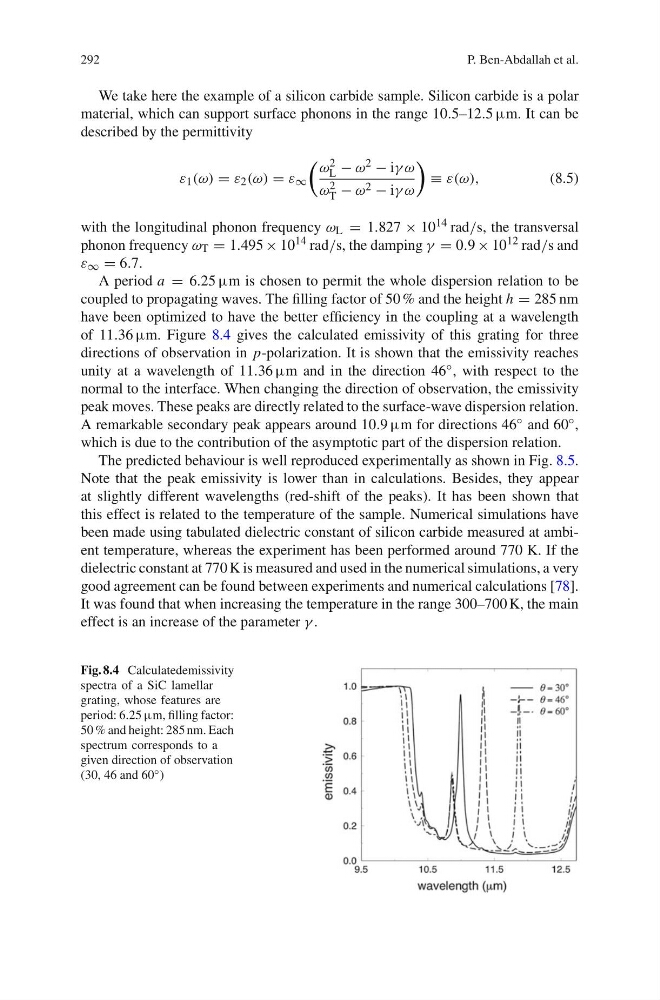
of 11.36 µm. Figure 8.4 gives the calculated emissivity of this grating for three
directions of observation in p-polarization. It is shown that the emissivity reaches
unity at a wavelength of 11.36 µm and in the direction 46 ◦ , with respect to the
normal to the interface. When changing the direction of observation, the emissivity
peak moves. These peaks are directly related to the surface-wave dispersion relation.
A remarkable secondary peak appears around 10.9 µm for directions 46 ◦ and 60 ◦ ,
which is due to the contribution of the asymptotic part of the dispersion relation.
The predicted behaviour is well reproduced experimentally as shown in Fig. 8.5.
Note that the peak emissivity is lower than in calculations. Besides, they appear
at slightly different wavelengths (red-shift of the peaks). It has been shown that
this effect is related to the temperature of the sample. Numerical simulations have
been made using tabulated dielectric constant of silicon carbide measured at ambient temperature, whereas the experiment has been performed around 770 K. If the
dielectric constant at 770 K is measured and used in the numerical simulations, a very
good agreement can be found between experiments and numerical calculations [78].
It was found that when increasing the temperature in the range 300–700 K, the main
effect is an increase of the parameter γ .
Fig. 8.4 Calculatedemissivity
spectra of a SiC lamellar
grating, whose features are
period: 6.25 µm, filling factor:
50 % and height: 285 nm. Each
spectrum corresponds to a
given direction of observation
(30, 46 and 60 ◦ )
P. Ben-Abdallah et al.
We take here the example of a silicon carbide sample. Silicon carbide is a polar
material, which can support surface phonons in the range 10.5–12.5 µm. It can be
described by the permittivity
ε 1 (ω) = ε 2 (ω) = ε ∞
ω 2
L − ω 2 − iγ ω
ω 2
T − ω 2 − iγ ω
∈ ε(ω),
(8.5)
with the longitudinal phonon frequency ω L = 1.827 × 10 14 rad/s, the transversal
phonon frequency ω T = 1.495 × 10 14 rad/s, the damping γ = 0.9 × 10 12 rad/s and
ε ∞ = 6.7.
A period a = 6.25 µm is chosen to permit the whole dispersion relation to be
coupled to propagating waves. The filling factor of 50 % and the height h = 285 nm
have been optimized to have the better efficiency in the coupling at a wavelength
of 11.36 µm. Figure 8.4 gives the calculated emissivity of this grating for three
directions of observation in p-polarization. It is shown that the emissivity reaches
unity at a wavelength of 11.36 µm and in the direction 46 ◦ , with respect to the
normal to the interface. When changing the direction of observation, the emissivity
peak moves. These peaks are directly related to the surface-wave dispersion relation.
A remarkable secondary peak appears around 10.9 µm for directions 46 ◦ and 60 ◦ ,
which is due to the contribution of the asymptotic part of the dispersion relation.
The predicted behaviour is well reproduced experimentally as shown in Fig. 8.5.
Note that the peak emissivity is lower than in calculations. Besides, they appear
at slightly different wavelengths (red-shift of the peaks). It has been shown that
this effect is related to the temperature of the sample. Numerical simulations have
been made using tabulated dielectric constant of silicon carbide measured at ambient temperature, whereas the experiment has been performed around 770 K. If the
dielectric constant at 770 K is measured and used in the numerical simulations, a very
good agreement can be found between experiments and numerical calculations [78].
It was found that when increasing the temperature in the range 300–700 K, the main
effect is an increase of the parameter γ .
Fig. 8.4 Calculatedemissivity
spectra of a SiC lamellar
grating, whose features are
period: 6.25 µm, filling factor:
50 % and height: 285 nm. Each
spectrum corresponds to a
given direction of observation
(30, 46 and 60 ◦ )