

7 Ultrafast and Nonlinear Plasmon Dynamics
273
Ti:Sapphire
Spectrograph
metallic
tip
τ
λ 0
CCD
BBO
ω
=9.5 fs
=780 nm
2ω
τ
5 µm
0
1.0
0.8
0.6
0.4
0.2
0.0
0.4
0.2
0.0
Normalized incident intensity
Normalized SHG intensity
I SHG (I in )
2
(a)
(b)
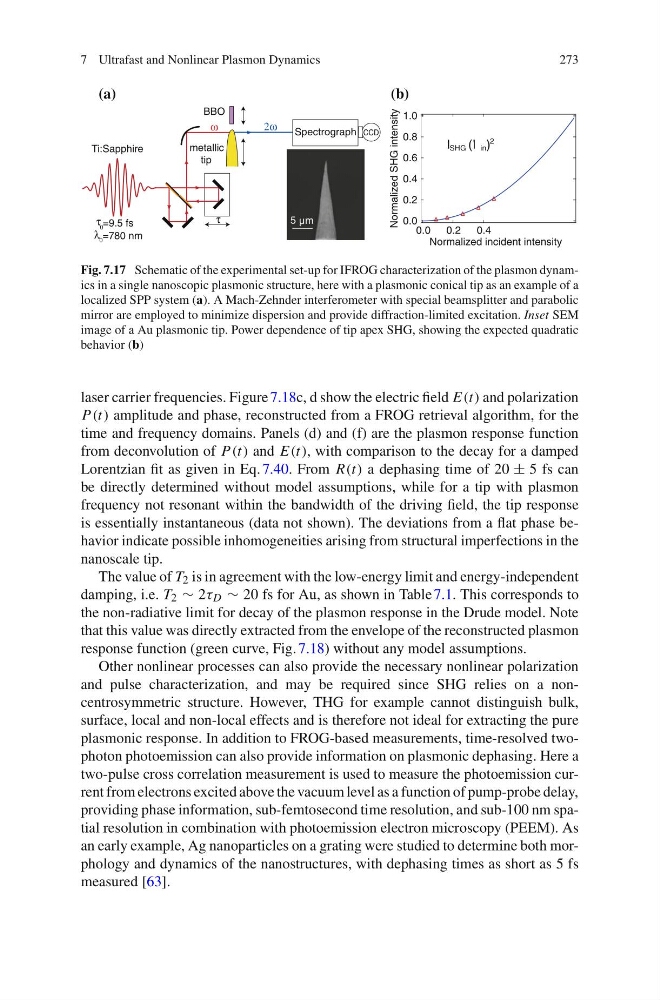
Fig. 7.17 Schematic of the experimental set-up for IFROG characterization of the plasmon dynamics in a single nanoscopic plasmonic structure, here with a plasmonic conical tip as an example of a
localized SPP system (a). A Mach-Zehnder interferometer with special beamsplitter and parabolic
mirror are employed to minimize dispersion and provide diffraction-limited excitation. Inset SEM
image of a Au plasmonic tip. Power dependence of tip apex SHG, showing the expected quadratic
behavior (b)
laser carrier frequencies. Figure 7.18c, d show the electric field E(t) and polarization
P(t) amplitude and phase, reconstructed from a FROG retrieval algorithm, for the
time and frequency domains. Panels (d) and (f) are the plasmon response function
from deconvolution of P(t) and E(t), with comparison to the decay for a damped
Lorentzian fit as given in Eq. 7.40. From R(t) a dephasing time of 20 ± 5 fs can
be directly determined without model assumptions, while for a tip with plasmon
frequency not resonant within the bandwidth of the driving field, the tip response
is essentially instantaneous (data not shown). The deviations from a flat phase behavior indicate possible inhomogeneities arising from structural imperfections in the
nanoscale tip.
The value of T 2 is in agreement with the low-energy limit and energy-independent
damping, i.e. T 2 ∝ 2τ D ∝ 20 fs for Au, as shown in Table 7.1. This corresponds to
the non-radiative limit for decay of the plasmon response in the Drude model. Note
that this value was directly extracted from the envelope of the reconstructed plasmon
response function (green curve, Fig. 7.18) without any model assumptions.
Other nonlinear processes can also provide the necessary nonlinear polarization
and pulse characterization, and may be required since SHG relies on a noncentrosymmetric structure. However, THG for example cannot distinguish bulk,
surface, local and non-local effects and is therefore not ideal for extracting the pure
plasmonic response. In addition to FROG-based measurements, time-resolved twophoton photoemission can also provide information on plasmonic dephasing. Here a
two-pulse cross correlation measurement is used to measure the photoemission current from electrons excited above the vacuum level as a function of pump-probe delay,
providing phase information, sub-femtosecond time resolution, and sub-100 nm spatial resolution in combination with photoemission electron microscopy (PEEM). As
an early example, Ag nanoparticles on a grating were studied to determine both morphology and dynamics of the nanostructures, with dephasing times as short as 5 fs
measured [63].
273
Ti:Sapphire
Spectrograph
metallic
tip
τ
λ 0
CCD
BBO
ω
=9.5 fs
=780 nm
2ω
τ
5 µm
0
1.0
0.8
0.6
0.4
0.2
0.0
0.4
0.2
0.0
Normalized incident intensity
Normalized SHG intensity
I SHG (I in )
2
(a)
(b)
Fig. 7.17 Schematic of the experimental set-up for IFROG characterization of the plasmon dynamics in a single nanoscopic plasmonic structure, here with a plasmonic conical tip as an example of a
localized SPP system (a). A Mach-Zehnder interferometer with special beamsplitter and parabolic
mirror are employed to minimize dispersion and provide diffraction-limited excitation. Inset SEM
image of a Au plasmonic tip. Power dependence of tip apex SHG, showing the expected quadratic
behavior (b)
laser carrier frequencies. Figure 7.18c, d show the electric field E(t) and polarization
P(t) amplitude and phase, reconstructed from a FROG retrieval algorithm, for the
time and frequency domains. Panels (d) and (f) are the plasmon response function
from deconvolution of P(t) and E(t), with comparison to the decay for a damped
Lorentzian fit as given in Eq. 7.40. From R(t) a dephasing time of 20 ± 5 fs can
be directly determined without model assumptions, while for a tip with plasmon
frequency not resonant within the bandwidth of the driving field, the tip response
is essentially instantaneous (data not shown). The deviations from a flat phase behavior indicate possible inhomogeneities arising from structural imperfections in the
nanoscale tip.
The value of T 2 is in agreement with the low-energy limit and energy-independent
damping, i.e. T 2 ∝ 2τ D ∝ 20 fs for Au, as shown in Table 7.1. This corresponds to
the non-radiative limit for decay of the plasmon response in the Drude model. Note
that this value was directly extracted from the envelope of the reconstructed plasmon
response function (green curve, Fig. 7.18) without any model assumptions.
Other nonlinear processes can also provide the necessary nonlinear polarization
and pulse characterization, and may be required since SHG relies on a noncentrosymmetric structure. However, THG for example cannot distinguish bulk,
surface, local and non-local effects and is therefore not ideal for extracting the pure
plasmonic response. In addition to FROG-based measurements, time-resolved twophoton photoemission can also provide information on plasmonic dephasing. Here a
two-pulse cross correlation measurement is used to measure the photoemission current from electrons excited above the vacuum level as a function of pump-probe delay,
providing phase information, sub-femtosecond time resolution, and sub-100 nm spatial resolution in combination with photoemission electron microscopy (PEEM). As
an early example, Ag nanoparticles on a grating were studied to determine both morphology and dynamics of the nanostructures, with dephasing times as short as 5 fs
measured [63].