

7 Ultrafast and Nonlinear Plasmon Dynamics
243
Table 7.1 Free carrier density n, plasma frequency ω p , Drude relaxation time τ D , effective mass
m ≥ , correction term ε ≈ , Fermi velocity v f , band edge E g , skin depth at 1 eV δ, and mean free path
l for Cu, Ag, and Au. n and v F from Ashcroft and Mermin [4], τ D , ε ≈ , and band edge from fitting
to NIR-vis data in Johnson and Christy [9], and ω p calculated from Eq. 7.9.
n [cm −3 ] ω p (eV) τ D = 1/Γ 0 (fs) v F (nm/fs) E g (eV) l (nm) m ≥ /m ε ≈ δ (nm)
Cu 8.47 × 10 22
8.85
6.9 ± 0.7
1 .57
∝2.4 ∝11 1.49 1.6
24
Ag 5.86 × 10 22
9.17
31 ± 12
1.39
∝3.8 ∝43 0.96 3.7
22
Au 5.90 × 10 22
9.07
9.3 ± 0.9 to 14 ± 3
1.40
∝2.15 ∝13 0.99 9.84 24
For Au, τ D = 14 fs extracted from true Drude free electron behavior [10], with (9.3 ± 0.9) fs
reflecting modifications in behavior due to polarization of core electrons at shorter wavelengths [9].
(Values for 300 K.)
1
-20
-40
-60
1.5
2
2 . 5
3
Energy (eV)
0
2
4
6
ε im
ε re
Experimental
Drude
Drude (no damping)
0
-2
2
4
6
8
10
Conductivity
σ
(S/m x 10
5
)
1
1.5
2
2.5
3
Energy (eV)
σ re
σ im
Experimental
Drude
Drude (no damping)
Dielectric function
ε
(a)
(b)
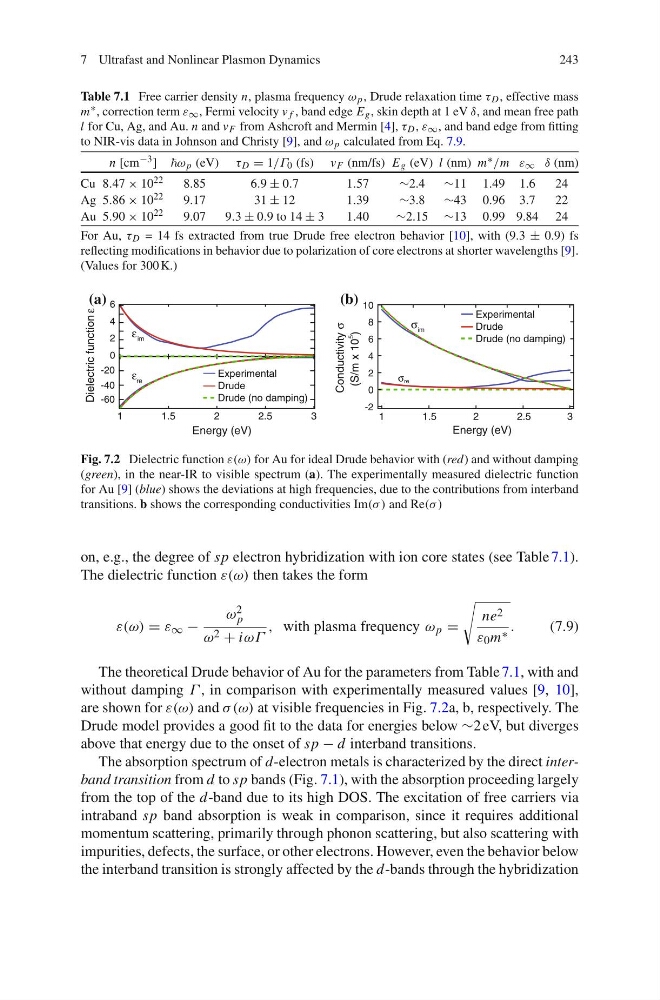
Fig. 7.2 Dielectric function ε(ω) for Au for ideal Drude behavior with (red) and without damping
(green), in the near-IR to visible spectrum (a). The experimentally measured dielectric function
for Au [9] (blue) shows the deviations at high frequencies, due to the contributions from interband
transitions. b shows the corresponding conductivities Im(σ ) and Re(σ )
on, e.g., the degree of sp electron hybridization with ion core states (see Table 7.1).
The dielectric function ε(ω) then takes the form
ε(ω) = ε ≈ −
ω 2
p
ω 2 + iωΓ
, with plasma frequency ω p =
ne 2
ε 0 m ≥ .
(7.9)
The theoretical Drude behavior of Au for the parameters from Table 7.1, with and
without damping Γ , in comparison with experimentally measured values [9, 10],
are shown for ε(ω) and σ (ω) at visible frequencies in Fig. 7.2a, b, respectively. The
Drude model provides a good fit to the data for energies below ∝2 eV, but diverges
above that energy due to the onset of sp − d interband transitions.
The absorption spectrum of d-electron metals is characterized by the direct interband transition from d to sp bands (Fig. 7.1), with the absorption proceeding largely
from the top of the d-band due to its high DOS. The excitation of free carriers via
intraband sp band absorption is weak in comparison, since it requires additional
momentum scattering, primarily through phonon scattering, but also scattering with
impurities, defects, the surface, or other electrons. However, even the behavior below
the interband transition is strongly affected by the d-bands through the hybridization
243
Table 7.1 Free carrier density n, plasma frequency ω p , Drude relaxation time τ D , effective mass
m ≥ , correction term ε ≈ , Fermi velocity v f , band edge E g , skin depth at 1 eV δ, and mean free path
l for Cu, Ag, and Au. n and v F from Ashcroft and Mermin [4], τ D , ε ≈ , and band edge from fitting
to NIR-vis data in Johnson and Christy [9], and ω p calculated from Eq. 7.9.
n [cm −3 ] ω p (eV) τ D = 1/Γ 0 (fs) v F (nm/fs) E g (eV) l (nm) m ≥ /m ε ≈ δ (nm)
Cu 8.47 × 10 22
8.85
6.9 ± 0.7
1 .57
∝2.4 ∝11 1.49 1.6
24
Ag 5.86 × 10 22
9.17
31 ± 12
1.39
∝3.8 ∝43 0.96 3.7
22
Au 5.90 × 10 22
9.07
9.3 ± 0.9 to 14 ± 3
1.40
∝2.15 ∝13 0.99 9.84 24
For Au, τ D = 14 fs extracted from true Drude free electron behavior [10], with (9.3 ± 0.9) fs
reflecting modifications in behavior due to polarization of core electrons at shorter wavelengths [9].
(Values for 300 K.)
1
-20
-40
-60
1.5
2
2 . 5
3
Energy (eV)
0
2
4
6
ε im
ε re
Experimental
Drude
Drude (no damping)
0
-2
2
4
6
8
10
Conductivity
σ
(S/m x 10
5
)
1
1.5
2
2.5
3
Energy (eV)
σ re
σ im
Experimental
Drude
Drude (no damping)
Dielectric function
ε
(a)
(b)
Fig. 7.2 Dielectric function ε(ω) for Au for ideal Drude behavior with (red) and without damping
(green), in the near-IR to visible spectrum (a). The experimentally measured dielectric function
for Au [9] (blue) shows the deviations at high frequencies, due to the contributions from interband
transitions. b shows the corresponding conductivities Im(σ ) and Re(σ )
on, e.g., the degree of sp electron hybridization with ion core states (see Table 7.1).
The dielectric function ε(ω) then takes the form
ε(ω) = ε ≈ −
ω 2
p
ω 2 + iωΓ
, with plasma frequency ω p =
ne 2
ε 0 m ≥ .
(7.9)
The theoretical Drude behavior of Au for the parameters from Table 7.1, with and
without damping Γ , in comparison with experimentally measured values [9, 10],
are shown for ε(ω) and σ (ω) at visible frequencies in Fig. 7.2a, b, respectively. The
Drude model provides a good fit to the data for energies below ∝2 eV, but diverges
above that energy due to the onset of sp − d interband transitions.
The absorption spectrum of d-electron metals is characterized by the direct interband transition from d to sp bands (Fig. 7.1), with the absorption proceeding largely
from the top of the d-band due to its high DOS. The excitation of free carriers via
intraband sp band absorption is weak in comparison, since it requires additional
momentum scattering, primarily through phonon scattering, but also scattering with
impurities, defects, the surface, or other electrons. However, even the behavior below
the interband transition is strongly affected by the d-bands through the hybridization