

80
Y. Ozaki et al.
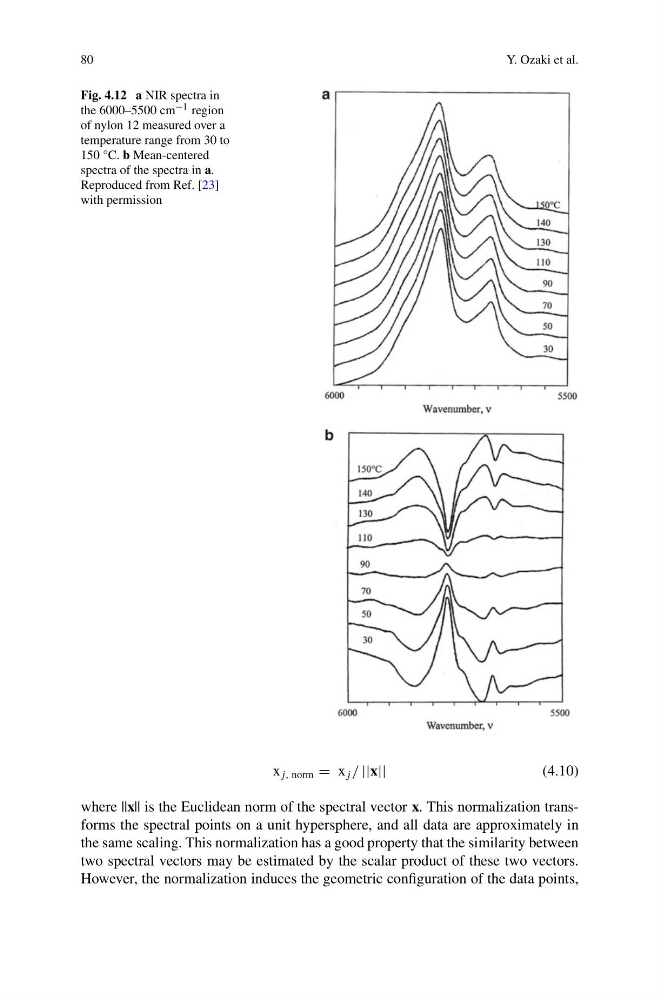
Fig. 4.12 a NIR spectra in
the 6000–5500 cm −1 region
of nylon 12 measured over a
temperature range from 30 to
150 °C. b Mean-centered
spectra of the spectra in a.
Reproduced from Ref. [23]
with permission
x j, norm = x j / ||x||
(4.10)
where ||x|| is the Euclidean norm of the spectral vector x. This normalization transforms the spectral points on a unit hypersphere, and all data are approximately in
the same scaling. This normalization has a good property that the similarity between
two spectral vectors may be estimated by the scalar product of these two vectors.
However, the normalization induces the geometric configuration of the data points,
Y. Ozaki et al.
Fig. 4.12 a NIR spectra in
the 6000–5500 cm −1 region
of nylon 12 measured over a
temperature range from 30 to
150 °C. b Mean-centered
spectra of the spectra in a.
Reproduced from Ref. [23]
with permission
x j, norm = x j / ||x||
(4.10)
where ||x|| is the Euclidean norm of the spectral vector x. This normalization transforms the spectral points on a unit hypersphere, and all data are approximately in
the same scaling. This normalization has a good property that the similarity between
two spectral vectors may be estimated by the scalar product of these two vectors.
However, the normalization induces the geometric configuration of the data points,