

4 Spectral Analysis in the NIR Spectroscopy
81
either the clustering structure or the spreading directions, substantially different from
the original one, which may result in a misleading in the understanding of the data
in exploratory data analysis. In addition, the variation in spreading directions has a
significant effect on principal component analysis (PCA)-related analysis. Therefore,
one must be careful enough in using normalization in situations where exploratory
data analysis and PCA-related procedures, such as PCA, partial least squares (PLS),
and so on, are concerned.
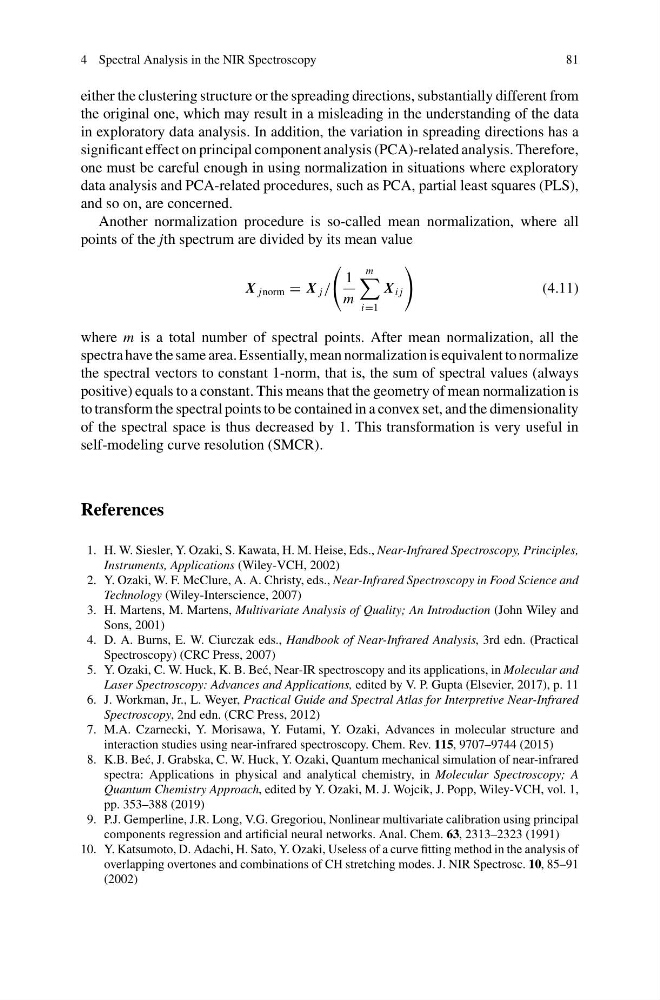
Another normalization procedure is so-called mean normalization, where all
points of the jth spectrum are divided by its mean value
X jnorm = X j /
1
m
m
i=1
X i j
(4.11)
where m is a total number of spectral points. After mean normalization, all the
spectra have the same area. Essentially, mean normalization is equivalent to normalize
the spectral vectors to constant 1-norm, that is, the sum of spectral values (always
positive) equals to a constant. This means that the geometry of mean normalization is
to transform the spectral points to be contained in a convex set, and the dimensionality
of the spectral space is thus decreased by 1. This transformation is very useful in
self-modeling curve resolution (SMCR).
References
1. H. W. Siesler, Y. Ozaki, S. Kawata, H. M. Heise, Eds., Near-Infrared Spectroscopy, Principles,
Instruments, Applications (Wiley-VCH, 2002)
2. Y. Ozaki, W. F. McClure, A. A. Christy, eds., Near-Infrared Spectroscopy in Food Science and
Technology (Wiley-Interscience, 2007)
3. H. Martens, M. Martens, Multivariate Analysis of Quality; An Introduction (John Wiley and
Sons, 2001)
4. D. A. Burns, E. W. Ciurczak eds., Handbook of Near-Infrared Analysis, 3rd edn. (Practical
Spectroscopy) (CRC Press, 2007)
5. Y. Ozaki, C. W. Huck, K. B. Be´ c, Near-IR spectroscopy and its applications, in Molecular and
Laser Spectroscopy: Advances and Applications, edited by V. P. Gupta (Elsevier, 2017), p. 11
6. J. Workman, Jr., L. Weyer, Practical Guide and Spectral Atlas for Interpretive Near-Infrared
Spectroscopy, 2nd edn. (CRC Press, 2012)
7. M.A. Czarnecki, Y. Morisawa, Y. Futami, Y. Ozaki, Advances in molecular structure and
interaction studies using near-infrared spectroscopy. Chem. Rev. 115, 9707–9744 (2015)
8. K.B. Be´ c, J. Grabska, C. W. Huck, Y. Ozaki, Quantum mechanical simulation of near-infrared
spectra: Applications in physical and analytical chemistry, in Molecular Spectroscopy; A
Quantum Chemistry Approach, edited by Y. Ozaki, M. J. Wojcik, J. Popp, Wiley-VCH, vol. 1,
pp. 353–388 (2019)
9. P.J. Gemperline, J.R. Long, V.G. Gregoriou, Nonlinear multivariate calibration using principal
components regression and artificial neural networks. Anal. Chem. 63, 2313–2323 (1991)
10. Y. Katsumoto, D. Adachi, H. Sato, Y. Ozaki, Useless of a curve fitting method in the analysis of
overlapping overtones and combinations of CH stretching modes. J. NIR Spectrosc. 10, 85–91
(2002)
81
either the clustering structure or the spreading directions, substantially different from
the original one, which may result in a misleading in the understanding of the data
in exploratory data analysis. In addition, the variation in spreading directions has a
significant effect on principal component analysis (PCA)-related analysis. Therefore,
one must be careful enough in using normalization in situations where exploratory
data analysis and PCA-related procedures, such as PCA, partial least squares (PLS),
and so on, are concerned.
Another normalization procedure is so-called mean normalization, where all
points of the jth spectrum are divided by its mean value
X jnorm = X j /
1
m
m
i=1
X i j
(4.11)
where m is a total number of spectral points. After mean normalization, all the
spectra have the same area. Essentially, mean normalization is equivalent to normalize
the spectral vectors to constant 1-norm, that is, the sum of spectral values (always
positive) equals to a constant. This means that the geometry of mean normalization is
to transform the spectral points to be contained in a convex set, and the dimensionality
of the spectral space is thus decreased by 1. This transformation is very useful in
self-modeling curve resolution (SMCR).
References
1. H. W. Siesler, Y. Ozaki, S. Kawata, H. M. Heise, Eds., Near-Infrared Spectroscopy, Principles,
Instruments, Applications (Wiley-VCH, 2002)
2. Y. Ozaki, W. F. McClure, A. A. Christy, eds., Near-Infrared Spectroscopy in Food Science and
Technology (Wiley-Interscience, 2007)
3. H. Martens, M. Martens, Multivariate Analysis of Quality; An Introduction (John Wiley and
Sons, 2001)
4. D. A. Burns, E. W. Ciurczak eds., Handbook of Near-Infrared Analysis, 3rd edn. (Practical
Spectroscopy) (CRC Press, 2007)
5. Y. Ozaki, C. W. Huck, K. B. Be´ c, Near-IR spectroscopy and its applications, in Molecular and
Laser Spectroscopy: Advances and Applications, edited by V. P. Gupta (Elsevier, 2017), p. 11
6. J. Workman, Jr., L. Weyer, Practical Guide and Spectral Atlas for Interpretive Near-Infrared
Spectroscopy, 2nd edn. (CRC Press, 2012)
7. M.A. Czarnecki, Y. Morisawa, Y. Futami, Y. Ozaki, Advances in molecular structure and
interaction studies using near-infrared spectroscopy. Chem. Rev. 115, 9707–9744 (2015)
8. K.B. Be´ c, J. Grabska, C. W. Huck, Y. Ozaki, Quantum mechanical simulation of near-infrared
spectra: Applications in physical and analytical chemistry, in Molecular Spectroscopy; A
Quantum Chemistry Approach, edited by Y. Ozaki, M. J. Wojcik, J. Popp, Wiley-VCH, vol. 1,
pp. 353–388 (2019)
9. P.J. Gemperline, J.R. Long, V.G. Gregoriou, Nonlinear multivariate calibration using principal
components regression and artificial neural networks. Anal. Chem. 63, 2313–2323 (1991)
10. Y. Katsumoto, D. Adachi, H. Sato, Y. Ozaki, Useless of a curve fitting method in the analysis of
overlapping overtones and combinations of CH stretching modes. J. NIR Spectrosc. 10, 85–91
(2002)