

586
R. W. Kessler and W. Kessler
RON93
RON95
RON97
RON100
PC-1 (65%)
-0,3 -0,2 -0,1
0
0,1
0,2
0,3
0,4
0,5
PC-2 (22%)
-0,4
-0,3
-0,2
-0,1
0
0,1
0,2
0,3
0,4
Scores
a)
summer
winter
Reference Y (RON, Factor-3)
91
92
93
94
95
96
97
98
99
100 101 102
Predicted Y (RON, Factor-3)
90
91
92
93
94
95
96
97
98
99
100
101
102
Predicted vs. Reference
CalibraƟon (240 samples)
R-Square: 0.956
RMSEC: 0.61
CrossvalidaƟon (20 random
segments,
12 samples each)
R-Square: 0.952
RMSECV: 0.64
Wavelength range: 4700 -3700 cm -1
240 Samples
b)
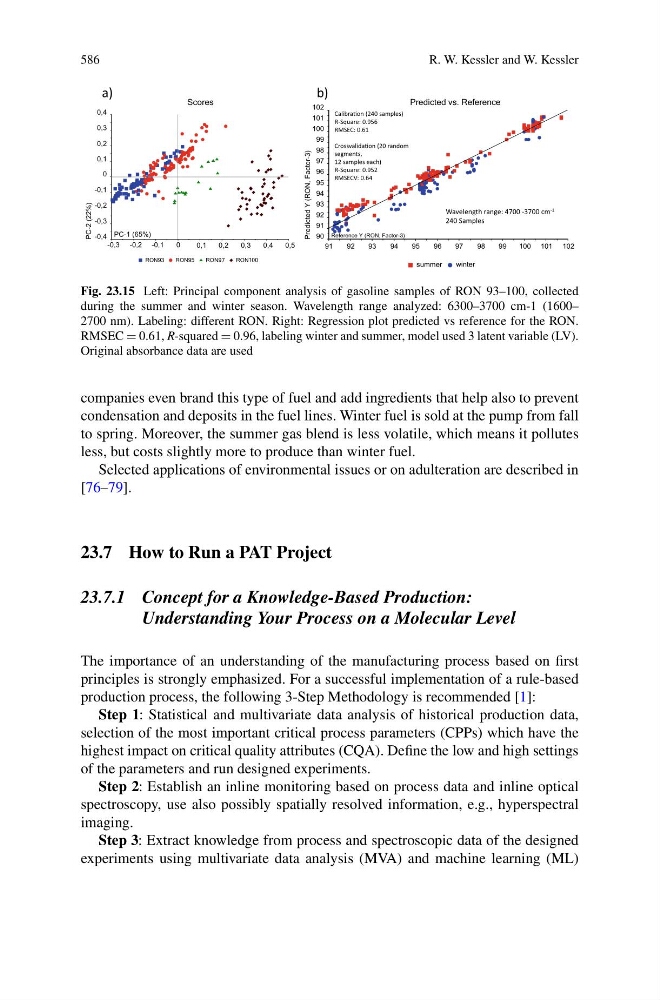
Fig. 23.15 Left: Principal component analysis of gasoline samples of RON 93–100, collected
during the summer and winter season. Wavelength range analyzed: 6300–3700 cm-1 (1600–
2700 nm). Labeling: different RON. Right: Regression plot predicted vs reference for the RON.
RMSEC = 0.61, R-squared = 0.96, labeling winter and summer, model used 3 latent variable (LV).
Original absorbance data are used
companies even brand this type of fuel and add ingredients that help also to prevent
condensation and deposits in the fuel lines. Winter fuel is sold at the pump from fall
to spring. Moreover, the summer gas blend is less volatile, which means it pollutes
less, but costs slightly more to produce than winter fuel.
Selected applications of environmental issues or on adulteration are described in
[76–79].
23.7 How to Run a PAT Project
23.7.1 Concept for a Knowledge-Based Production:
Understanding Your Process on a Molecular Level
The importance of an understanding of the manufacturing process based on first
principles is strongly emphasized. For a successful implementation of a rule-based
production process, the following 3-Step Methodology is recommended [1]:
Step 1: Statistical and multivariate data analysis of historical production data,
selection of the most important critical process parameters (CPPs) which have the
highest impact on critical quality attributes (CQA). Define the low and high settings
of the parameters and run designed experiments.
Step 2: Establish an inline monitoring based on process data and inline optical
spectroscopy, use also possibly spatially resolved information, e.g., hyperspectral
imaging.
Step 3: Extract knowledge from process and spectroscopic data of the designed
experiments using multivariate data analysis (MVA) and machine learning (ML)
R. W. Kessler and W. Kessler
RON93
RON95
RON97
RON100
PC-1 (65%)
-0,3 -0,2 -0,1
0
0,1
0,2
0,3
0,4
0,5
PC-2 (22%)
-0,4
-0,3
-0,2
-0,1
0
0,1
0,2
0,3
0,4
Scores
a)
summer
winter
Reference Y (RON, Factor-3)
91
92
93
94
95
96
97
98
99
100 101 102
Predicted Y (RON, Factor-3)
90
91
92
93
94
95
96
97
98
99
100
101
102
Predicted vs. Reference
CalibraƟon (240 samples)
R-Square: 0.956
RMSEC: 0.61
CrossvalidaƟon (20 random
segments,
12 samples each)
R-Square: 0.952
RMSECV: 0.64
Wavelength range: 4700 -3700 cm -1
240 Samples
b)
Fig. 23.15 Left: Principal component analysis of gasoline samples of RON 93–100, collected
during the summer and winter season. Wavelength range analyzed: 6300–3700 cm-1 (1600–
2700 nm). Labeling: different RON. Right: Regression plot predicted vs reference for the RON.
RMSEC = 0.61, R-squared = 0.96, labeling winter and summer, model used 3 latent variable (LV).
Original absorbance data are used
companies even brand this type of fuel and add ingredients that help also to prevent
condensation and deposits in the fuel lines. Winter fuel is sold at the pump from fall
to spring. Moreover, the summer gas blend is less volatile, which means it pollutes
less, but costs slightly more to produce than winter fuel.
Selected applications of environmental issues or on adulteration are described in
[76–79].
23.7 How to Run a PAT Project
23.7.1 Concept for a Knowledge-Based Production:
Understanding Your Process on a Molecular Level
The importance of an understanding of the manufacturing process based on first
principles is strongly emphasized. For a successful implementation of a rule-based
production process, the following 3-Step Methodology is recommended [1]:
Step 1: Statistical and multivariate data analysis of historical production data,
selection of the most important critical process parameters (CPPs) which have the
highest impact on critical quality attributes (CQA). Define the low and high settings
of the parameters and run designed experiments.
Step 2: Establish an inline monitoring based on process data and inline optical
spectroscopy, use also possibly spatially resolved information, e.g., hyperspectral
imaging.
Step 3: Extract knowledge from process and spectroscopic data of the designed
experiments using multivariate data analysis (MVA) and machine learning (ML)