

23 Inline and Online Process Analytical Technology with an Outlook …
585
A
B
C
D
PC-1 (54%)
-0,5 -0,4 -0,3 -0,2 -0,1 0
0,1 0,2 0,3 0,4 0,5 0,6
PC-2 (38%)
-0,4
-0,3
-0,2
-0,1
0
0,1
0,2
0,3
0,4
0,5
0,6
Scores
a)
-0.3
-0.2
-0.1
0
0.1
0.2
2200
2300
2400
2500
PCA Scores
Wavelength nm
PC-1
PC-2
b)
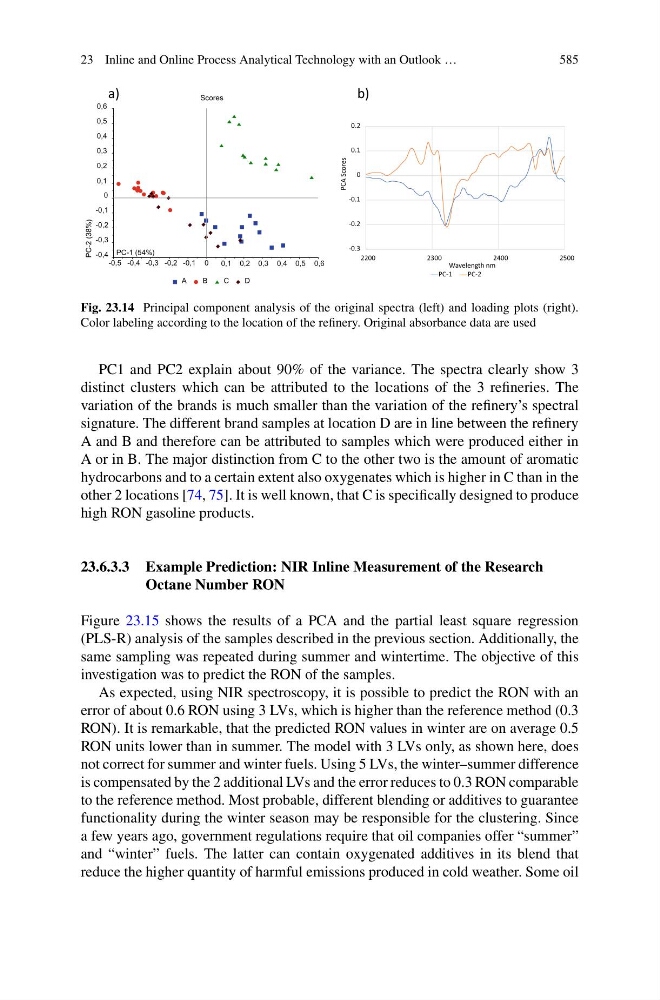
Fig. 23.14 Principal component analysis of the original spectra (left) and loading plots (right).
Color labeling according to the location of the refinery. Original absorbance data are used
PC1 and PC2 explain about 90% of the variance. The spectra clearly show 3
distinct clusters which can be attributed to the locations of the 3 refineries. The
variation of the brands is much smaller than the variation of the refinery’s spectral
signature. The different brand samples at location D are in line between the refinery
A and B and therefore can be attributed to samples which were produced either in
A or in B. The major distinction from C to the other two is the amount of aromatic
hydrocarbons and to a certain extent also oxygenates which is higher in C than in the
other 2 locations [74, 75]. It is well known, that C is specifically designed to produce
high RON gasoline products.
23.6.3.3 Example Prediction: NIR Inline Measurement of the Research
Octane Number RON
Figure 23.15 shows the results of a PCA and the partial least square regression
(PLS-R) analysis of the samples described in the previous section. Additionally, the
same sampling was repeated during summer and wintertime. The objective of this
investigation was to predict the RON of the samples.
As expected, using NIR spectroscopy, it is possible to predict the RON with an
error of about 0.6 RON using 3 LVs, which is higher than the reference method (0.3
RON). It is remarkable, that the predicted RON values in winter are on average 0.5
RON units lower than in summer. The model with 3 LVs only, as shown here, does
not correct for summer and winter fuels. Using 5 LVs, the winter–summer difference
is compensated by the 2 additional LVs and the error reduces to 0.3 RON comparable
to the reference method. Most probable, different blending or additives to guarantee
functionality during the winter season may be responsible for the clustering. Since
a few years ago, government regulations require that oil companies offer “summer”
and “winter” fuels. The latter can contain oxygenated additives in its blend that
reduce the higher quantity of harmful emissions produced in cold weather. Some oil
585
A
B
C
D
PC-1 (54%)
-0,5 -0,4 -0,3 -0,2 -0,1 0
0,1 0,2 0,3 0,4 0,5 0,6
PC-2 (38%)
-0,4
-0,3
-0,2
-0,1
0
0,1
0,2
0,3
0,4
0,5
0,6
Scores
a)
-0.3
-0.2
-0.1
0
0.1
0.2
2200
2300
2400
2500
PCA Scores
Wavelength nm
PC-1
PC-2
b)
Fig. 23.14 Principal component analysis of the original spectra (left) and loading plots (right).
Color labeling according to the location of the refinery. Original absorbance data are used
PC1 and PC2 explain about 90% of the variance. The spectra clearly show 3
distinct clusters which can be attributed to the locations of the 3 refineries. The
variation of the brands is much smaller than the variation of the refinery’s spectral
signature. The different brand samples at location D are in line between the refinery
A and B and therefore can be attributed to samples which were produced either in
A or in B. The major distinction from C to the other two is the amount of aromatic
hydrocarbons and to a certain extent also oxygenates which is higher in C than in the
other 2 locations [74, 75]. It is well known, that C is specifically designed to produce
high RON gasoline products.
23.6.3.3 Example Prediction: NIR Inline Measurement of the Research
Octane Number RON
Figure 23.15 shows the results of a PCA and the partial least square regression
(PLS-R) analysis of the samples described in the previous section. Additionally, the
same sampling was repeated during summer and wintertime. The objective of this
investigation was to predict the RON of the samples.
As expected, using NIR spectroscopy, it is possible to predict the RON with an
error of about 0.6 RON using 3 LVs, which is higher than the reference method (0.3
RON). It is remarkable, that the predicted RON values in winter are on average 0.5
RON units lower than in summer. The model with 3 LVs only, as shown here, does
not correct for summer and winter fuels. Using 5 LVs, the winter–summer difference
is compensated by the 2 additional LVs and the error reduces to 0.3 RON comparable
to the reference method. Most probable, different blending or additives to guarantee
functionality during the winter season may be responsible for the clustering. Since
a few years ago, government regulations require that oil companies offer “summer”
and “winter” fuels. The latter can contain oxygenated additives in its blend that
reduce the higher quantity of harmful emissions produced in cold weather. Some oil