

544
D. Ishikawa et al.
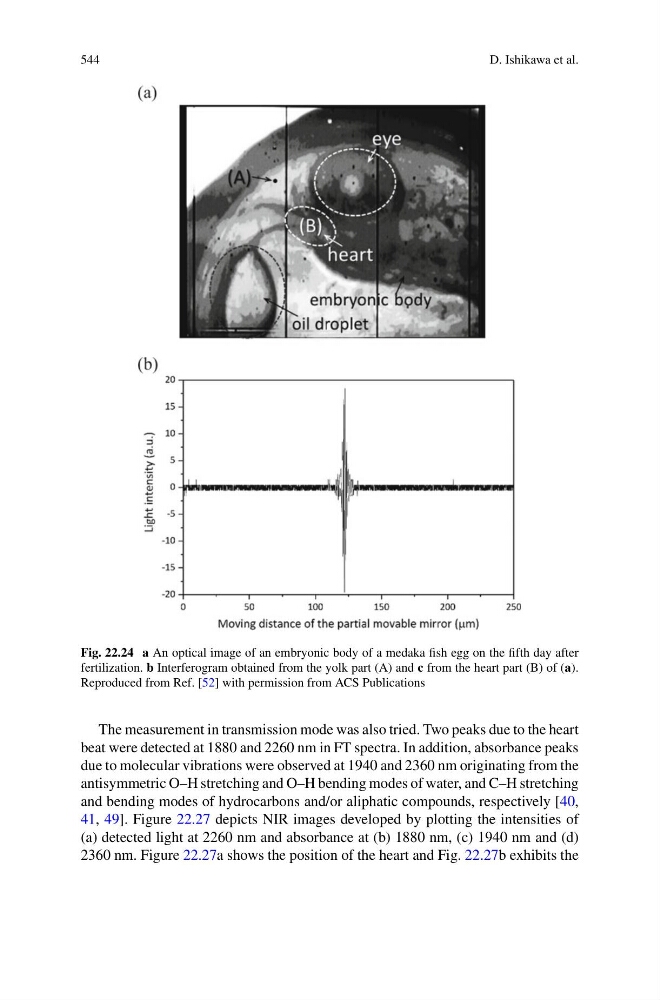
Fig. 22.24 a An optical image of an embryonic body of a medaka fish egg on the fifth day after
fertilization. b Interferogram obtained from the yolk part (A) and c from the heart part (B) of (a).
Reproduced from Ref. [52] with permission from ACS Publications
The measurement in transmission mode was also tried. Two peaks due to the heart
beat were detected at 1880 and 2260 nm in FT spectra. In addition, absorbance peaks
due to molecular vibrations were observed at 1940 and 2360 nm originating from the
antisymmetric O–H stretching and O–H bending modes of water, and C–H stretching
and bending modes of hydrocarbons and/or aliphatic compounds, respectively [40,
41, 49]. Figure 22.27 depicts NIR images developed by plotting the intensities of
(a) detected light at 2260 nm and absorbance at (b) 1880 nm, (c) 1940 nm and (d)
2360 nm. Figure 22.27a shows the position of the heart and Fig. 22.27b exhibits the
D. Ishikawa et al.
Fig. 22.24 a An optical image of an embryonic body of a medaka fish egg on the fifth day after
fertilization. b Interferogram obtained from the yolk part (A) and c from the heart part (B) of (a).
Reproduced from Ref. [52] with permission from ACS Publications
The measurement in transmission mode was also tried. Two peaks due to the heart
beat were detected at 1880 and 2260 nm in FT spectra. In addition, absorbance peaks
due to molecular vibrations were observed at 1940 and 2360 nm originating from the
antisymmetric O–H stretching and O–H bending modes of water, and C–H stretching
and bending modes of hydrocarbons and/or aliphatic compounds, respectively [40,
41, 49]. Figure 22.27 depicts NIR images developed by plotting the intensities of
(a) detected light at 2260 nm and absorbance at (b) 1880 nm, (c) 1940 nm and (d)
2360 nm. Figure 22.27a shows the position of the heart and Fig. 22.27b exhibits the