

22 NIR Imaging
543
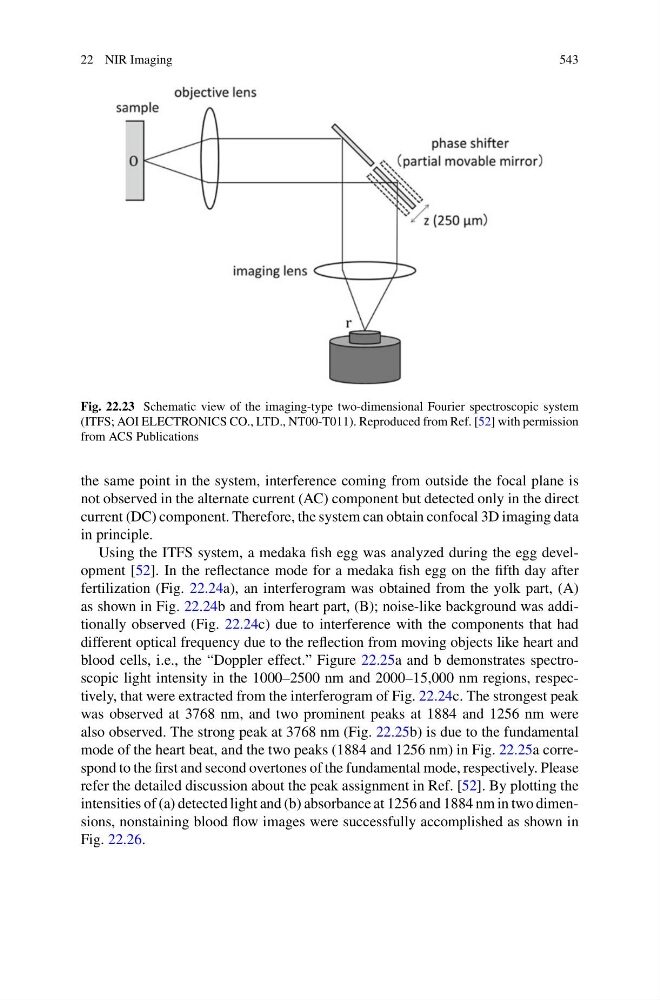
Fig. 22.23 Schematic view of the imaging-type two-dimensional Fourier spectroscopic system
(ITFS; AOI ELECTRONICS CO., LTD., NT00-T011). Reproduced from Ref. [52] with permission
from ACS Publications
the same point in the system, interference coming from outside the focal plane is
not observed in the alternate current (AC) component but detected only in the direct
current (DC) component. Therefore, the system can obtain confocal 3D imaging data
in principle.
Using the ITFS system, a medaka fish egg was analyzed during the egg development [52]. In the reflectance mode for a medaka fish egg on the fifth day after
fertilization (Fig. 22.24a), an interferogram was obtained from the yolk part, (A)
as shown in Fig. 22.24b and from heart part, (B); noise-like background was additionally observed (Fig. 22.24c) due to interference with the components that had
different optical frequency due to the reflection from moving objects like heart and
blood cells, i.e., the “Doppler effect.” Figure 22.25a and b demonstrates spectroscopic light intensity in the 1000–2500 nm and 2000–15,000 nm regions, respectively, that were extracted from the interferogram of Fig. 22.24c. The strongest peak
was observed at 3768 nm, and two prominent peaks at 1884 and 1256 nm were
also observed. The strong peak at 3768 nm (Fig. 22.25b) is due to the fundamental
mode of the heart beat, and the two peaks (1884 and 1256 nm) in Fig. 22.25a correspond to the first and second overtones of the fundamental mode, respectively. Please
refer the detailed discussion about the peak assignment in Ref. [52]. By plotting the
intensities of (a) detected light and (b) absorbance at 1256 and 1884 nm in two dimensions, nonstaining blood flow images were successfully accomplished as shown in
Fig. 22.26.
543
Fig. 22.23 Schematic view of the imaging-type two-dimensional Fourier spectroscopic system
(ITFS; AOI ELECTRONICS CO., LTD., NT00-T011). Reproduced from Ref. [52] with permission
from ACS Publications
the same point in the system, interference coming from outside the focal plane is
not observed in the alternate current (AC) component but detected only in the direct
current (DC) component. Therefore, the system can obtain confocal 3D imaging data
in principle.
Using the ITFS system, a medaka fish egg was analyzed during the egg development [52]. In the reflectance mode for a medaka fish egg on the fifth day after
fertilization (Fig. 22.24a), an interferogram was obtained from the yolk part, (A)
as shown in Fig. 22.24b and from heart part, (B); noise-like background was additionally observed (Fig. 22.24c) due to interference with the components that had
different optical frequency due to the reflection from moving objects like heart and
blood cells, i.e., the “Doppler effect.” Figure 22.25a and b demonstrates spectroscopic light intensity in the 1000–2500 nm and 2000–15,000 nm regions, respectively, that were extracted from the interferogram of Fig. 22.24c. The strongest peak
was observed at 3768 nm, and two prominent peaks at 1884 and 1256 nm were
also observed. The strong peak at 3768 nm (Fig. 22.25b) is due to the fundamental
mode of the heart beat, and the two peaks (1884 and 1256 nm) in Fig. 22.25a correspond to the first and second overtones of the fundamental mode, respectively. Please
refer the detailed discussion about the peak assignment in Ref. [52]. By plotting the
intensities of (a) detected light and (b) absorbance at 1256 and 1884 nm in two dimensions, nonstaining blood flow images were successfully accomplished as shown in
Fig. 22.26.