

22 NIR Imaging
529
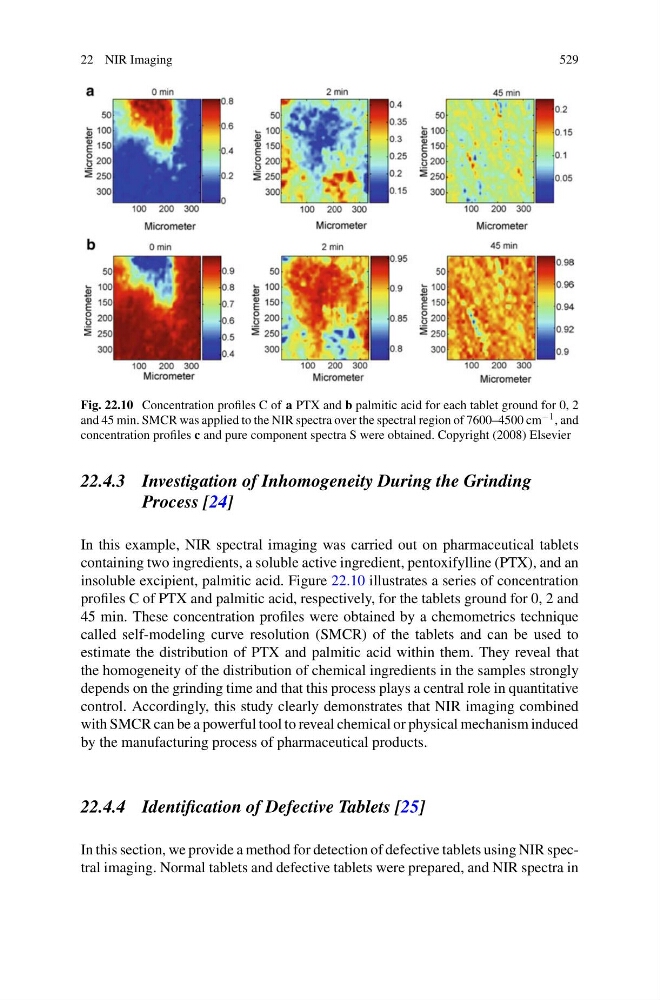
Fig. 22.10 Concentration profiles C of a PTX and b palmitic acid for each tablet ground for 0, 2
and 45 min. SMCR was applied to the NIR spectra over the spectral region of 7600–4500 cm −1 , and
concentration profiles c and pure component spectra S were obtained. Copyright (2008) Elsevier
22.4.3 Investigation of Inhomogeneity During the Grinding
Process [24]
In this example, NIR spectral imaging was carried out on pharmaceutical tablets
containing two ingredients, a soluble active ingredient, pentoxifylline (PTX), and an
insoluble excipient, palmitic acid. Figure 22.10 illustrates a series of concentration
profiles C of PTX and palmitic acid, respectively, for the tablets ground for 0, 2 and
45 min. These concentration profiles were obtained by a chemometrics technique
called self-modeling curve resolution (SMCR) of the tablets and can be used to
estimate the distribution of PTX and palmitic acid within them. They reveal that
the homogeneity of the distribution of chemical ingredients in the samples strongly
depends on the grinding time and that this process plays a central role in quantitative
control. Accordingly, this study clearly demonstrates that NIR imaging combined
with SMCR can be a powerful tool to reveal chemical or physical mechanism induced
by the manufacturing process of pharmaceutical products.
22.4.4 Identification of Defective Tablets [25]
In this section, we provide a method for detection of defective tablets using NIR spectral imaging. Normal tablets and defective tablets were prepared, and NIR spectra in
529
Fig. 22.10 Concentration profiles C of a PTX and b palmitic acid for each tablet ground for 0, 2
and 45 min. SMCR was applied to the NIR spectra over the spectral region of 7600–4500 cm −1 , and
concentration profiles c and pure component spectra S were obtained. Copyright (2008) Elsevier
22.4.3 Investigation of Inhomogeneity During the Grinding
Process [24]
In this example, NIR spectral imaging was carried out on pharmaceutical tablets
containing two ingredients, a soluble active ingredient, pentoxifylline (PTX), and an
insoluble excipient, palmitic acid. Figure 22.10 illustrates a series of concentration
profiles C of PTX and palmitic acid, respectively, for the tablets ground for 0, 2 and
45 min. These concentration profiles were obtained by a chemometrics technique
called self-modeling curve resolution (SMCR) of the tablets and can be used to
estimate the distribution of PTX and palmitic acid within them. They reveal that
the homogeneity of the distribution of chemical ingredients in the samples strongly
depends on the grinding time and that this process plays a central role in quantitative
control. Accordingly, this study clearly demonstrates that NIR imaging combined
with SMCR can be a powerful tool to reveal chemical or physical mechanism induced
by the manufacturing process of pharmaceutical products.
22.4.4 Identification of Defective Tablets [25]
In this section, we provide a method for detection of defective tablets using NIR spectral imaging. Normal tablets and defective tablets were prepared, and NIR spectra in