

530
D. Ishikawa et al.
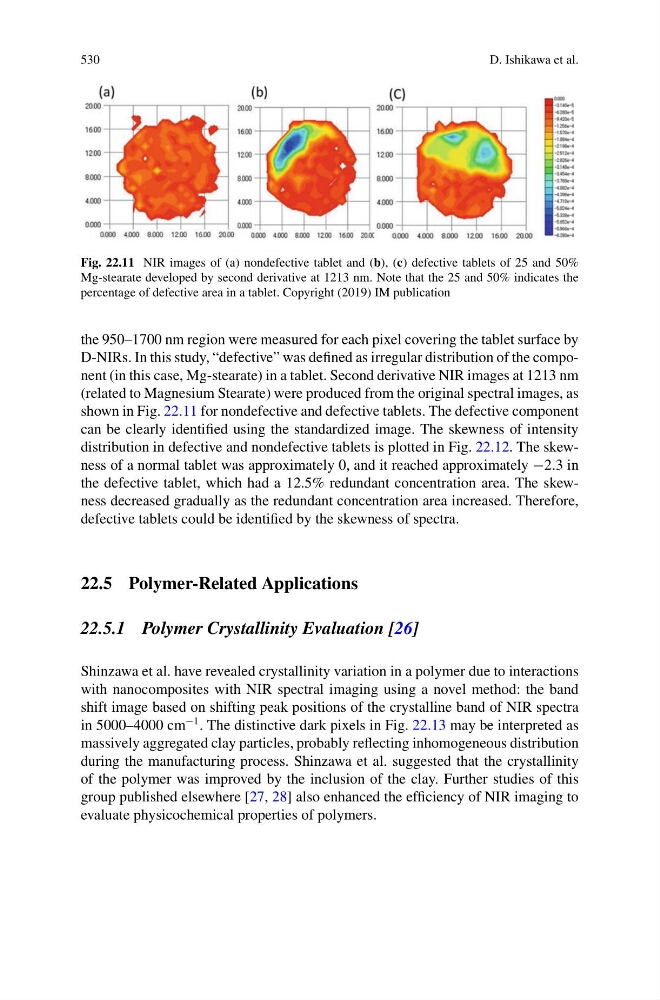
Fig. 22.11 NIR images of (a) nondefective tablet and (b), (c) defective tablets of 25 and 50%
Mg-stearate developed by second derivative at 1213 nm. Note that the 25 and 50% indicates the
percentage of defective area in a tablet. Copyright (2019) IM publication
the 950–1700 nm region were measured for each pixel covering the tablet surface by
D-NIRs. In this study, “defective” was defined as irregular distribution of the component (in this case, Mg-stearate) in a tablet. Second derivative NIR images at 1213 nm
(related to Magnesium Stearate) were produced from the original spectral images, as
shown in Fig. 22.11 for nondefective and defective tablets. The defective component
can be clearly identified using the standardized image. The skewness of intensity
distribution in defective and nondefective tablets is plotted in Fig. 22.12. The skewness of a normal tablet was approximately 0, and it reached approximately −2.3 in
the defective tablet, which had a 12.5% redundant concentration area. The skewness decreased gradually as the redundant concentration area increased. Therefore,
defective tablets could be identified by the skewness of spectra.
22.5 Polymer-Related Applications
22.5.1 Polymer Crystallinity Evaluation [26]
Shinzawa et al. have revealed crystallinity variation in a polymer due to interactions
with nanocomposites with NIR spectral imaging using a novel method: the band
shift image based on shifting peak positions of the crystalline band of NIR spectra
in 5000–4000 cm
−1 . The distinctive dark pixels in Fig. 22.13 may be interpreted as
massively aggregated clay particles, probably reflecting inhomogeneous distribution
during the manufacturing process. Shinzawa et al. suggested that the crystallinity
of the polymer was improved by the inclusion of the clay. Further studies of this
group published elsewhere [27, 28] also enhanced the efficiency of NIR imaging to
evaluate physicochemical properties of polymers.
D. Ishikawa et al.
Fig. 22.11 NIR images of (a) nondefective tablet and (b), (c) defective tablets of 25 and 50%
Mg-stearate developed by second derivative at 1213 nm. Note that the 25 and 50% indicates the
percentage of defective area in a tablet. Copyright (2019) IM publication
the 950–1700 nm region were measured for each pixel covering the tablet surface by
D-NIRs. In this study, “defective” was defined as irregular distribution of the component (in this case, Mg-stearate) in a tablet. Second derivative NIR images at 1213 nm
(related to Magnesium Stearate) were produced from the original spectral images, as
shown in Fig. 22.11 for nondefective and defective tablets. The defective component
can be clearly identified using the standardized image. The skewness of intensity
distribution in defective and nondefective tablets is plotted in Fig. 22.12. The skewness of a normal tablet was approximately 0, and it reached approximately −2.3 in
the defective tablet, which had a 12.5% redundant concentration area. The skewness decreased gradually as the redundant concentration area increased. Therefore,
defective tablets could be identified by the skewness of spectra.
22.5 Polymer-Related Applications
22.5.1 Polymer Crystallinity Evaluation [26]
Shinzawa et al. have revealed crystallinity variation in a polymer due to interactions
with nanocomposites with NIR spectral imaging using a novel method: the band
shift image based on shifting peak positions of the crystalline band of NIR spectra
in 5000–4000 cm
−1 . The distinctive dark pixels in Fig. 22.13 may be interpreted as
massively aggregated clay particles, probably reflecting inhomogeneous distribution
during the manufacturing process. Shinzawa et al. suggested that the crystallinity
of the polymer was improved by the inclusion of the clay. Further studies of this
group published elsewhere [27, 28] also enhanced the efficiency of NIR imaging to
evaluate physicochemical properties of polymers.