

528
D. Ishikawa et al.
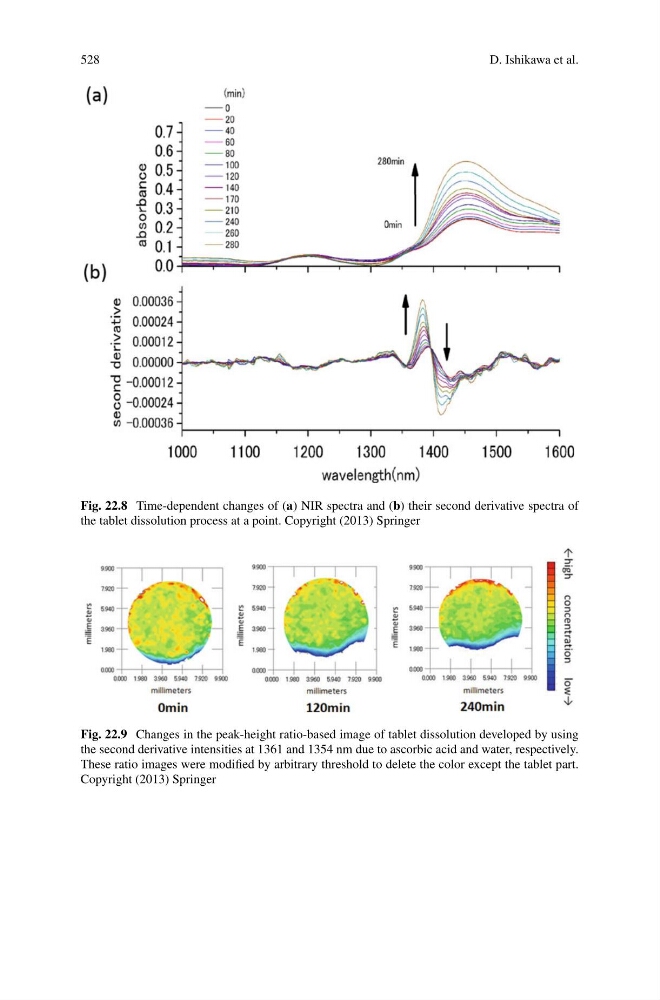
Fig. 22.8 Time-dependent changes of (a) NIR spectra and (b) their second derivative spectra of
the tablet dissolution process at a point. Copyright (2013) Springer
Fig. 22.9 Changes in the peak-height ratio-based image of tablet dissolution developed by using
the second derivative intensities at 1361 and 1354 nm due to ascorbic acid and water, respectively.
These ratio images were modified by arbitrary threshold to delete the color except the tablet part.
Copyright (2013) Springer
D. Ishikawa et al.
Fig. 22.8 Time-dependent changes of (a) NIR spectra and (b) their second derivative spectra of
the tablet dissolution process at a point. Copyright (2013) Springer
Fig. 22.9 Changes in the peak-height ratio-based image of tablet dissolution developed by using
the second derivative intensities at 1361 and 1354 nm due to ascorbic acid and water, respectively.
These ratio images were modified by arbitrary threshold to delete the color except the tablet part.
Copyright (2013) Springer