

22 NIR Imaging
527
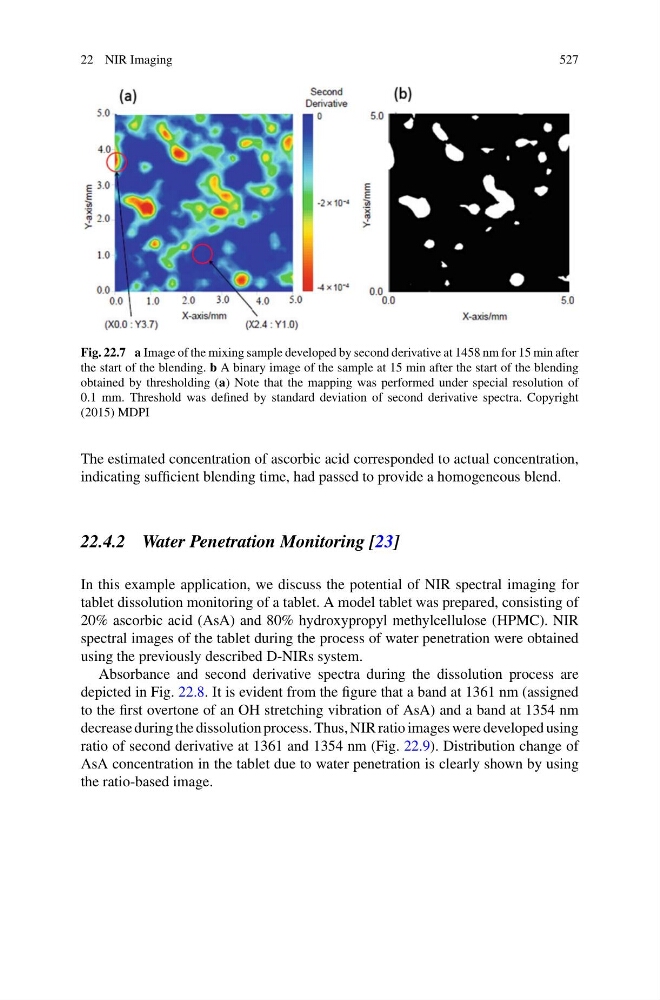
Fig. 22.7 a Image of the mixing sample developed by second derivative at 1458 nm for 15 min after
the start of the blending. b A binary image of the sample at 15 min after the start of the blending
obtained by thresholding (a) Note that the mapping was performed under special resolution of
0.1 mm. Threshold was defined by standard deviation of second derivative spectra. Copyright
(2015) MDPI
The estimated concentration of ascorbic acid corresponded to actual concentration,
indicating sufficient blending time, had passed to provide a homogeneous blend.
22.4.2 Water Penetration Monitoring [23]
In this example application, we discuss the potential of NIR spectral imaging for
tablet dissolution monitoring of a tablet. A model tablet was prepared, consisting of
20% ascorbic acid (AsA) and 80% hydroxypropyl methylcellulose (HPMC). NIR
spectral images of the tablet during the process of water penetration were obtained
using the previously described D-NIRs system.
Absorbance and second derivative spectra during the dissolution process are
depicted in Fig. 22.8. It is evident from the figure that a band at 1361 nm (assigned
to the first overtone of an OH stretching vibration of AsA) and a band at 1354 nm
decrease during the dissolution process. Thus, NIR ratio images were developed using
ratio of second derivative at 1361 and 1354 nm (Fig. 22.9). Distribution change of
AsA concentration in the tablet due to water penetration is clearly shown by using
the ratio-based image.
527
Fig. 22.7 a Image of the mixing sample developed by second derivative at 1458 nm for 15 min after
the start of the blending. b A binary image of the sample at 15 min after the start of the blending
obtained by thresholding (a) Note that the mapping was performed under special resolution of
0.1 mm. Threshold was defined by standard deviation of second derivative spectra. Copyright
(2015) MDPI
The estimated concentration of ascorbic acid corresponded to actual concentration,
indicating sufficient blending time, had passed to provide a homogeneous blend.
22.4.2 Water Penetration Monitoring [23]
In this example application, we discuss the potential of NIR spectral imaging for
tablet dissolution monitoring of a tablet. A model tablet was prepared, consisting of
20% ascorbic acid (AsA) and 80% hydroxypropyl methylcellulose (HPMC). NIR
spectral images of the tablet during the process of water penetration were obtained
using the previously described D-NIRs system.
Absorbance and second derivative spectra during the dissolution process are
depicted in Fig. 22.8. It is evident from the figure that a band at 1361 nm (assigned
to the first overtone of an OH stretching vibration of AsA) and a band at 1354 nm
decrease during the dissolution process. Thus, NIR ratio images were developed using
ratio of second derivative at 1361 and 1354 nm (Fig. 22.9). Distribution change of
AsA concentration in the tablet due to water penetration is clearly shown by using
the ratio-based image.