

19 Bio-applications of NIR Spectroscopy
423
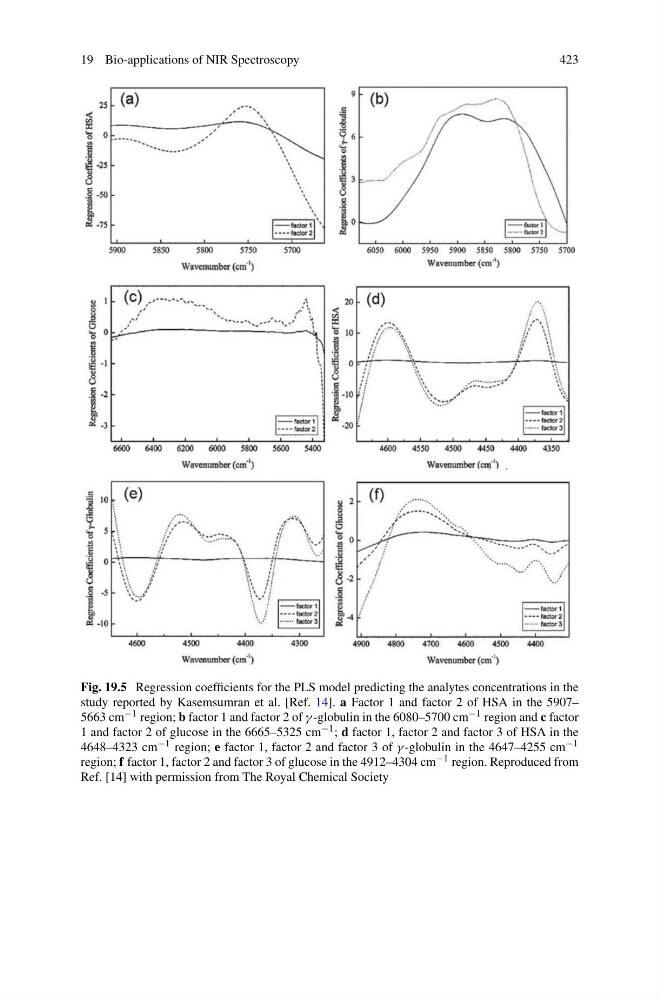
Fig. 19.5 Regression coefficients for the PLS model predicting the analytes concentrations in the
study reported by Kasemsumran et al. [Ref. 14]. a Factor 1 and factor 2 of HSA in the 5907–
5663 cm −1 region; b factor 1 and factor 2 of γ -globulin in the 6080–5700 cm −1 region and c factor
1 and factor 2 of glucose in the 6665–5325 cm −1 ; d factor 1, factor 2 and factor 3 of HSA in the
4648–4323 cm −1 region; e factor 1, factor 2 and factor 3 of γ -globulin in the 4647–4255 cm −1
region; f factor 1, factor 2 and factor 3 of glucose in the 4912–4304 cm −1 region. Reproduced from
Ref. [14] with permission from The Royal Chemical Society
423
Fig. 19.5 Regression coefficients for the PLS model predicting the analytes concentrations in the
study reported by Kasemsumran et al. [Ref. 14]. a Factor 1 and factor 2 of HSA in the 5907–
5663 cm −1 region; b factor 1 and factor 2 of γ -globulin in the 6080–5700 cm −1 region and c factor
1 and factor 2 of glucose in the 6665–5325 cm −1 ; d factor 1, factor 2 and factor 3 of HSA in the
4648–4323 cm −1 region; e factor 1, factor 2 and factor 3 of γ -globulin in the 4647–4255 cm −1
region; f factor 1, factor 2 and factor 3 of glucose in the 4912–4304 cm −1 region. Reproduced from
Ref. [14] with permission from The Royal Chemical Society