

370
T. Ma et al.
of 79 μm by means of visible-NIR-HSI imaging [46]. The R
2 value between the
present method and X-ray microdensitometer was 0.810 with an RMSE of 6.54 ×
10
−2 g cm
−3 . The difference between latewood and earlywood (i.e., inside every
single annual ring) was shown clearly. Lestander et al. applied NIR-HSI images to
separate wood chips with elevated levels of extractives [47]. Meder et al. used HSI
images for detecting the compression part of softwood. The compression wood is
required to be detected at an early age since its higher proportion of lignin and lower
cellulose easily, which causes further trucks. [48]. Kobori et al. [49] and Ma. et al.
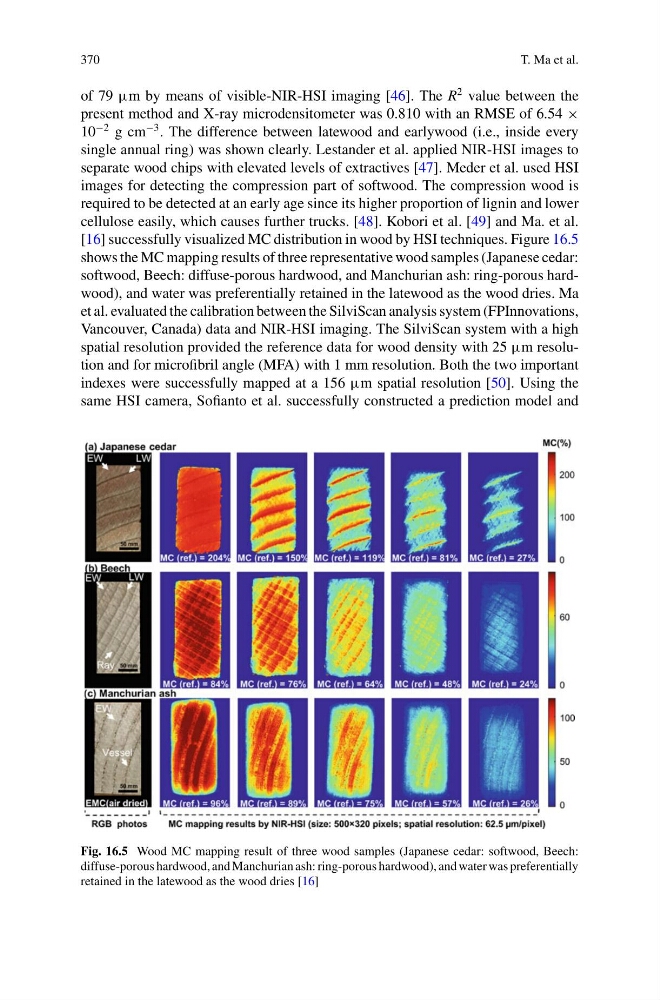
[16] successfully visualized MC distribution in wood by HSI techniques. Figure 16.5
shows the MC mapping results of three representative wood samples (Japanese cedar:
softwood, Beech: diffuse-porous hardwood, and Manchurian ash: ring-porous hardwood), and water was preferentially retained in the latewood as the wood dries. Ma
et al. evaluated the calibration between the SilviScan analysis system (FPInnovations,
Vancouver, Canada) data and NIR-HSI imaging. The SilviScan system with a high
spatial resolution provided the reference data for wood density with 25 μm resolution and for microfibril angle (MFA) with 1 mm resolution. Both the two important
indexes were successfully mapped at a 156 μm spatial resolution [50]. Using the
same HSI camera, Sofianto et al. successfully constructed a prediction model and
Fig. 16.5 Wood MC mapping result of three wood samples (Japanese cedar: softwood, Beech:
diffuse-porous hardwood, and Manchurian ash: ring-porous hardwood), and water was preferentially
retained in the latewood as the wood dries [16]
T. Ma et al.
of 79 μm by means of visible-NIR-HSI imaging [46]. The R
2 value between the
present method and X-ray microdensitometer was 0.810 with an RMSE of 6.54 ×
10
−2 g cm
−3 . The difference between latewood and earlywood (i.e., inside every
single annual ring) was shown clearly. Lestander et al. applied NIR-HSI images to
separate wood chips with elevated levels of extractives [47]. Meder et al. used HSI
images for detecting the compression part of softwood. The compression wood is
required to be detected at an early age since its higher proportion of lignin and lower
cellulose easily, which causes further trucks. [48]. Kobori et al. [49] and Ma. et al.
[16] successfully visualized MC distribution in wood by HSI techniques. Figure 16.5
shows the MC mapping results of three representative wood samples (Japanese cedar:
softwood, Beech: diffuse-porous hardwood, and Manchurian ash: ring-porous hardwood), and water was preferentially retained in the latewood as the wood dries. Ma
et al. evaluated the calibration between the SilviScan analysis system (FPInnovations,
Vancouver, Canada) data and NIR-HSI imaging. The SilviScan system with a high
spatial resolution provided the reference data for wood density with 25 μm resolution and for microfibril angle (MFA) with 1 mm resolution. Both the two important
indexes were successfully mapped at a 156 μm spatial resolution [50]. Using the
same HSI camera, Sofianto et al. successfully constructed a prediction model and
Fig. 16.5 Wood MC mapping result of three wood samples (Japanese cedar: softwood, Beech:
diffuse-porous hardwood, and Manchurian ash: ring-porous hardwood), and water was preferentially
retained in the latewood as the wood dries [16]