

13 Overview of Application of NIR Spectroscopy to Physical …
317
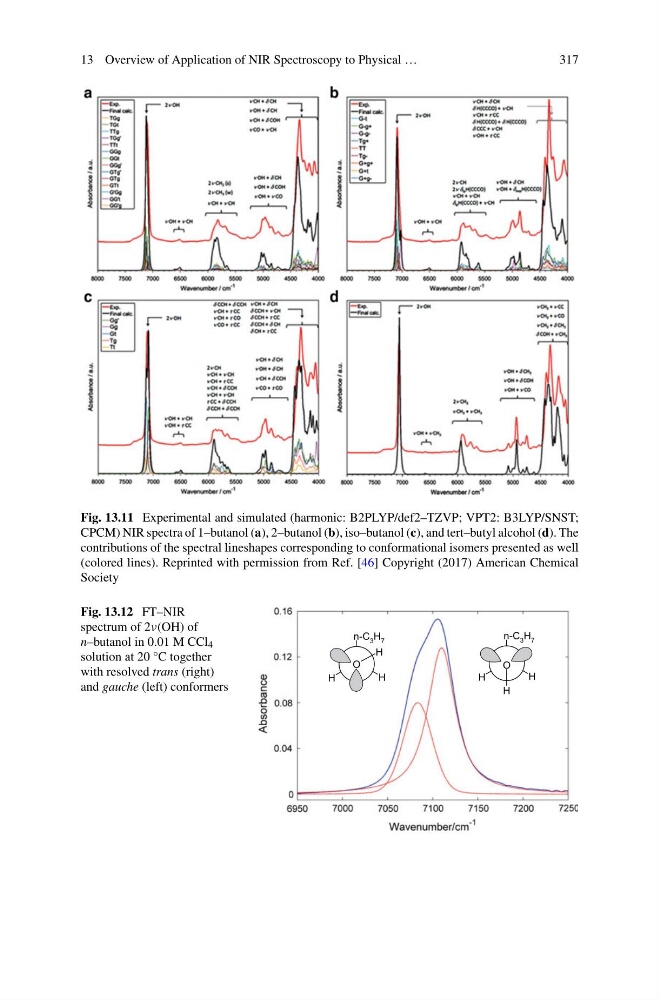
Fig. 13.11 Experimental and simulated (harmonic: B2PLYP/def2–TZVP; VPT2: B3LYP/SNST;
CPCM) NIR spectra of 1–butanol (a), 2–butanol (b), iso–butanol (c), and tert–butyl alcohol (d). The
contributions of the spectral lineshapes corresponding to conformational isomers presented as well
(colored lines). Reprinted with permission from Ref. [46] Copyright (2017) American Chemical
Society
Fig. 13.12 FT–NIR
spectrum of 2ν(OH) of
n–butanol in 0.01 M CCl 4
solution at 20 °C together
with resolved trans (right)
and gauche (left) conformers
O
H
H
H
n-C 3 H 7
H
H
n-C 3 H 7
O
H
317
Fig. 13.11 Experimental and simulated (harmonic: B2PLYP/def2–TZVP; VPT2: B3LYP/SNST;
CPCM) NIR spectra of 1–butanol (a), 2–butanol (b), iso–butanol (c), and tert–butyl alcohol (d). The
contributions of the spectral lineshapes corresponding to conformational isomers presented as well
(colored lines). Reprinted with permission from Ref. [46] Copyright (2017) American Chemical
Society
Fig. 13.12 FT–NIR
spectrum of 2ν(OH) of
n–butanol in 0.01 M CCl 4
solution at 20 °C together
with resolved trans (right)
and gauche (left) conformers
O
H
H
H
n-C 3 H 7
H
H
n-C 3 H 7
O
H