

316
M. A. Czarnecki et al.
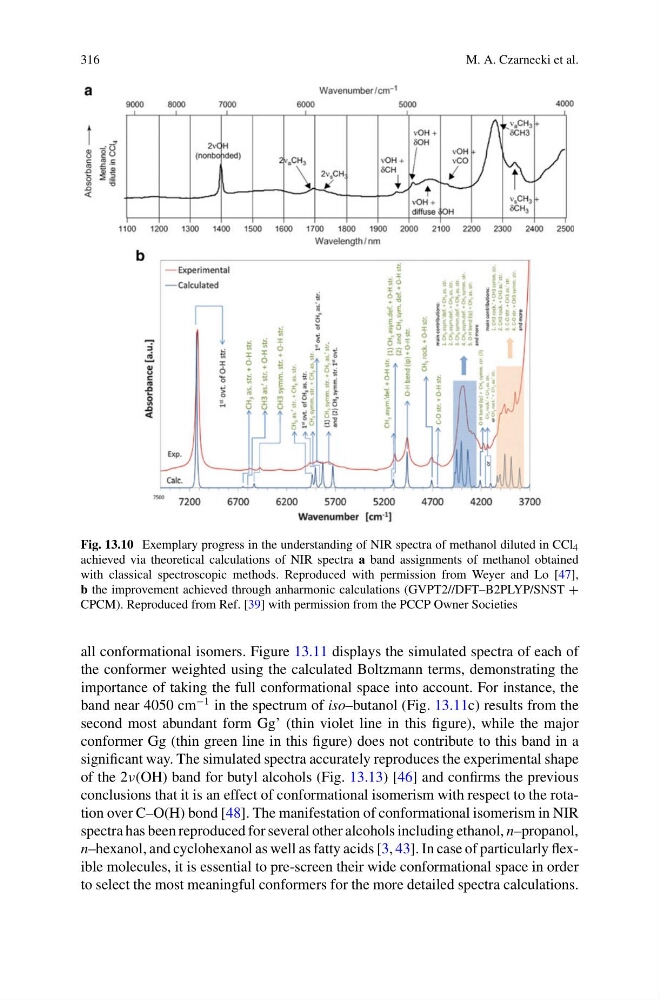
Fig. 13.10 Exemplary progress in the understanding of NIR spectra of methanol diluted in CCl 4
achieved via theoretical calculations of NIR spectra a band assignments of methanol obtained
with classical spectroscopic methods. Reproduced with permission from Weyer and Lo [47],
b the improvement achieved through anharmonic calculations (GVPT2//DFT–B2PLYP/SNST +
CPCM). Reproduced from Ref. [39] with permission from the PCCP Owner Societies
all conformational isomers. Figure 13.11 displays the simulated spectra of each of
the conformer weighted using the calculated Boltzmann terms, demonstrating the
importance of taking the full conformational space into account. For instance, the
band near 4050 cm
−1 in the spectrum of iso–butanol (Fig. 13.11c) results from the
second most abundant form Gg’ (thin violet line in this figure), while the major
conformer Gg (thin green line in this figure) does not contribute to this band in a
significant way. The simulated spectra accurately reproduces the experimental shape
of the 2ν(OH) band for butyl alcohols (Fig. 13.13) [46] and confirms the previous
conclusions that it is an effect of conformational isomerism with respect to the rotation over C–O(H) bond [48]. The manifestation of conformational isomerism in NIR
spectra has been reproduced for several other alcohols including ethanol, n–propanol,
n–hexanol, and cyclohexanol as well as fatty acids [3, 43]. In case of particularly flexible molecules, it is essential to pre-screen their wide conformational space in order
to select the most meaningful conformers for the more detailed spectra calculations.
M. A. Czarnecki et al.
Fig. 13.10 Exemplary progress in the understanding of NIR spectra of methanol diluted in CCl 4
achieved via theoretical calculations of NIR spectra a band assignments of methanol obtained
with classical spectroscopic methods. Reproduced with permission from Weyer and Lo [47],
b the improvement achieved through anharmonic calculations (GVPT2//DFT–B2PLYP/SNST +
CPCM). Reproduced from Ref. [39] with permission from the PCCP Owner Societies
all conformational isomers. Figure 13.11 displays the simulated spectra of each of
the conformer weighted using the calculated Boltzmann terms, demonstrating the
importance of taking the full conformational space into account. For instance, the
band near 4050 cm
−1 in the spectrum of iso–butanol (Fig. 13.11c) results from the
second most abundant form Gg’ (thin violet line in this figure), while the major
conformer Gg (thin green line in this figure) does not contribute to this band in a
significant way. The simulated spectra accurately reproduces the experimental shape
of the 2ν(OH) band for butyl alcohols (Fig. 13.13) [46] and confirms the previous
conclusions that it is an effect of conformational isomerism with respect to the rotation over C–O(H) bond [48]. The manifestation of conformational isomerism in NIR
spectra has been reproduced for several other alcohols including ethanol, n–propanol,
n–hexanol, and cyclohexanol as well as fatty acids [3, 43]. In case of particularly flexible molecules, it is essential to pre-screen their wide conformational space in order
to select the most meaningful conformers for the more detailed spectra calculations.