

16
Y. Ozaki and Y. Morisawa
water structure and water contents in various materials. Bands at 10613, 8807, and
8762 cm
−1 are assigned to 2v 1 + v 3 , v 1 + v 2 + v 3 , and 2v 1 + v 2 , respectively.
The band at 10613 cm
− [1] is valuable for estimating water contents in foods and
materials. As you can see here, several bands attributed to the second and third order
combination modes appear in the short wavelength region. More detailed analysis
of water spectra will be discussed in Sect. 4.1.2.
(b) Methanol
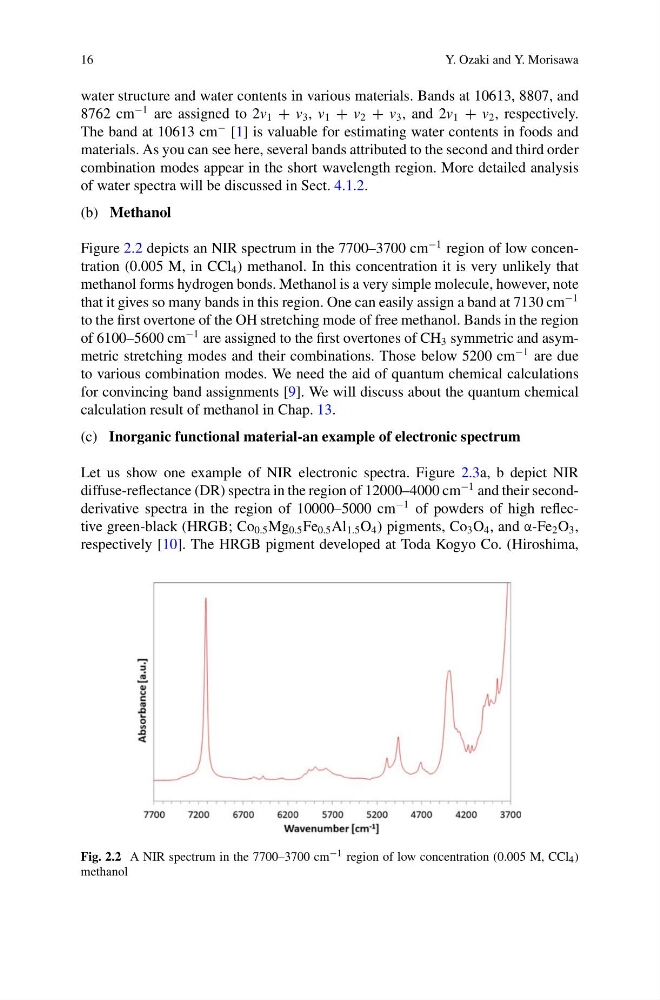
Figure 2.2 depicts an NIR spectrum in the 7700–3700 cm
−1 region of low concentration (0.005 M, in CCl 4 ) methanol. In this concentration it is very unlikely that
methanol forms hydrogen bonds. Methanol is a very simple molecule, however, note
that it gives so many bands in this region. One can easily assign a band at 7130 cm
−1
to the first overtone of the OH stretching mode of free methanol. Bands in the region
of 6100–5600 cm
−1 are assigned to the first overtones of CH 3 symmetric and asymmetric stretching modes and their combinations. Those below 5200 cm
−1 are due
to various combination modes. We need the aid of quantum chemical calculations
for convincing band assignments [9]. We will discuss about the quantum chemical
calculation result of methanol in Chap. 13.
(c) Inorganic functional material-an example of electronic spectrum
Let us show one example of NIR electronic spectra. Figure 2.3a, b depict NIR
diffuse-reflectance (DR) spectra in the region of 12000–4000 cm
−1 and their secondderivative spectra in the region of 10000–5000 cm
−1 of powders of high reflective green-black (HRGB; Co 0.5 Mg 0.5 Fe 0.5 Al 1.5 O 4 ) pigments, Co 3 O 4 , and α-Fe 2 O 3 ,
respectively [10]. The HRGB pigment developed at Toda Kogyo Co. (Hiroshima,
Fig. 2.2 A NIR spectrum in the 7700–3700 cm −1 region of low concentration (0.005 M, CCl 4 )
methanol
Y. Ozaki and Y. Morisawa
water structure and water contents in various materials. Bands at 10613, 8807, and
8762 cm
−1 are assigned to 2v 1 + v 3 , v 1 + v 2 + v 3 , and 2v 1 + v 2 , respectively.
The band at 10613 cm
− [1] is valuable for estimating water contents in foods and
materials. As you can see here, several bands attributed to the second and third order
combination modes appear in the short wavelength region. More detailed analysis
of water spectra will be discussed in Sect. 4.1.2.
(b) Methanol
Figure 2.2 depicts an NIR spectrum in the 7700–3700 cm
−1 region of low concentration (0.005 M, in CCl 4 ) methanol. In this concentration it is very unlikely that
methanol forms hydrogen bonds. Methanol is a very simple molecule, however, note
that it gives so many bands in this region. One can easily assign a band at 7130 cm
−1
to the first overtone of the OH stretching mode of free methanol. Bands in the region
of 6100–5600 cm
−1 are assigned to the first overtones of CH 3 symmetric and asymmetric stretching modes and their combinations. Those below 5200 cm
−1 are due
to various combination modes. We need the aid of quantum chemical calculations
for convincing band assignments [9]. We will discuss about the quantum chemical
calculation result of methanol in Chap. 13.
(c) Inorganic functional material-an example of electronic spectrum
Let us show one example of NIR electronic spectra. Figure 2.3a, b depict NIR
diffuse-reflectance (DR) spectra in the region of 12000–4000 cm
−1 and their secondderivative spectra in the region of 10000–5000 cm
−1 of powders of high reflective green-black (HRGB; Co 0.5 Mg 0.5 Fe 0.5 Al 1.5 O 4 ) pigments, Co 3 O 4 , and α-Fe 2 O 3 ,
respectively [10]. The HRGB pigment developed at Toda Kogyo Co. (Hiroshima,
Fig. 2.2 A NIR spectrum in the 7700–3700 cm −1 region of low concentration (0.005 M, CCl 4 )
methanol